Research Article - (2023) Volume 9, Issue 1
Received: 26-Jan-2023, Manuscript No. IPCP-23-15693; Editor assigned: 30-Jan-2023, Pre QC No. IPCP-23-15693 (PQ); Reviewed: 13-Feb-2023, QC No. IPCP-23-15693; Revised: 20-Feb-2023, Manuscript No. IPCP-23-15693 (Q); Published: 27-Feb-2023, DOI: 10.35841/2471-9854.23.9.006
Background: Several magnetic resonance imaging markers of cognitive impairment have been reported in multiple sclerosis. Nonetheless, measurement often requires volumetry, a time consuming technique that has problems with respect to accuracy in the segmentation of brain structures. The corpus callosum area is a marker of cognitive impairment that requires no volumetric technique; however, the usefulness of this marker has not been fully examined. This study aimed to determine whether the normalized corpus callosum area is a feasible and sensitive magnetic resonance imaging marker of cognitive impairment in multiple sclerosis.
Methods and findings: A total of 136 patients with multiple sclerosis who underwent the Montreal cognitive assessment and magnetic resonance imaging examination of the head were retrospectively reviewed. The normalized corpus callosum area was manually measured on a sagittal midline T1 weighted sequence using a picture archiving communication system. The normalized volumes of the brain parenchyma, cortex, thalamus, hippocampus, putamen, globus pallidus, caudate, and cerebellum were measured using FreeSurfer software. The normalized lesion volume was measured using the SPM software. Receiver operating characteristic curves were drawn for 10 MRI markers, along with the optimal cutoff value, sensitivity, specificity, and area under the curve. The Youden index was calculated for all parameters.
The normalized corpus callosum area was moderately associated with the Montreal cognitive assessment score after adjusting for age, sex, disease duration, and type of magnetic resonance imaging scanner (ρ=0.56; p<0.001). This indicator showed the strongest correlation among all the magnetic resonance imaging markers. Among all MRI markers, the normalized corpus callosum area showed the largest area under the curve (0.782) and had the second highest Youden index (0.463), following the normalized lesion volume.
Results: 90.2% of the participants were women, 84% had been under surgery with a Sleeve Gastrectomy technique while the rest underwent Roux-Y Gastric Bypass. The obtained model showed a significant correlation between the SCL 90-R subscales and the COVID-19 related psychological distress and both were negatively correlated to participant’s age. The model had adequate goodness-of-fit indicators (Chi-square goodness-of-fit (χ2): 78.007, df: 64, p: 0.112; Root Mean Square Error of Approximation (RMSEA): 0.047; Goodness of Fit Index (GFI): 0.907; Comparative Fit Index (CFI): 0.991; Parsimony Normed Fit Index (PNFI): 0.670; Akaike Information Criterion (AIC): 160.007).
Conclusion: The normalized corpus callosum area, which is easily measured without volumetry, showed the strongest correlation with cognitive function. Therefore, this indicator may be a reliable and feasible marker of cognitive impairment in patients with multiple sclerosis.
Corpus callosum; Multiple sclerosis; Cognitive impairment; Magnetic resonance imaging
Multiple Sclerosis (MS) is associated with various neurological symptoms and is one of the most common demyelinating diseases of the central nervous system that particularly affect young people [1]. Physical disability has received attention as the main problem in MS. Cognitive Impairment (CI) has recently been considered a critical problem because it affects 40% to 70% of all patients and may result in a decreased quality of life [2]. Some reports have suggested that CI could be treated with disease modifying drugs and that early diagnosis and treatment are important [3-5]. However, CI often progresses insidiously without relapse, and it is difficult to notice by both patients and neurologists in the daily clinical setting [6]. While neuropsychological batteries are helpful, they have several shortcomings. First, these examinations are time consuming and difficult to perform frequently in the daily clinical setting. Second, physical disturbance, including limb weakness, may affect the results of some batteries. Third, these may be difficult to perform at frequent intervals because repeated use of neuropsychological batteries gives rise to practice effects. Moreover, the scores obtained by these batteries are discrete and not ideal for detecting subtle changes.
Magnetic Resonance Imaging (MRI) may provide supporting evidence to predict cognitive disturbance in MS. In previous studies, atrophy of the brain parenchyma [7], thalamus [8], cortex [9], and MS lesion volumes [10] were correlated with cognitive performance. The cerebellum might be involved in information processing [11,12]. These MRI biomarkers may be useful but not routinely used because volumetry is necessary. Although volumetry is a helpful technique for the assessment of structural MRI, the following shortcomings exist [13]: first, volumetry is often time consuming and requires a great deal of effort; second, spatial inaccuracy may arise from abnormalities, such as atrophy of brain structures and lesions due to MS, in semi-automated or automated methods. Therefore, these volumetric measurements are yet to be translated to clinical practice, and reliable and easy to use MRI biomarkers are unavailable in the clinical setting.
Corpus callosum atrophy is associated with CI in MS [7,14-18]. There are different methods for measuring the corpus callosum. The Corpus Callosum Index (CCI) is commonly used to assess the corpus callosum volume without volumetry and has been shown to be correlated with cognitive function [16,18]; nevertheless, this indicator is probably affected by the head size. The Corpus Callosum Area (CCA) is another indicator used to quantify atrophy, although it is used less commonly than the CCI [7,14,15]. The CCA can be easily measured in clinical settings because it does not require any volumetric technique and can be normalized to the head size. In a previous study conducted on 20 patients with relapsing remitting and secondary progressive MS, CCA showed good correlation with cognitive function [7]. However, apart from this study, data on the usefulness of CCA in cognitive function assessment are limited. The optimal cutoff value of CCA and whether the CCA is superior to previously report MRI markers remain unclear. Therefore, in this study, we aimed to determine whether CCA is a suitable marker for cognitive function in MS.
Patient Selection
We retrospectively reviewed 136 patients admitted to the National Center of Neurology and Psychiatry in Japan between 2016 and 2021 who underwent assessment using the Expanded Disability Status Scale (EDSS), Montreal Cognitive Assessment (MoCA), and MRI of the head. All patients met the 2017 McDonald diagnostic criteria [19]. We excluded patients with a recent relapse 4 weeks before the assessment or with other significant medical disorders. CI was defined as a score of ≤ 25 on the MoCA. This study was conducted in accordance with the principles embodied in the Declaration of Helsinki. Ethical approval and the need for acquision of informed consent from patients were waived by the local ethics committee of the National Center of Neurology and Psychiatry owing to the retrospective nature of the study and because all procedures being performed were part of routine clinical care.
MRI Data Acquisition
All patients underwent whole brain MRI on a 3T system (Philips Medical Systems, Best, the Netherlands, or Siemens, Munich, Germany). A 32 channel head coil was used for the examination. We obtained a sagittal 3D T1-weighted magnetization prepared rapid gradient-echo sequence (echo time [TE]/repetition time [TR]=7.18/3.46 or 1800/2.26 ms; field of view=261 × 261 or 250 × 250 mm; matrix size=384 × 384 or 320 × 288; number of excitations, 1; slice thickness, 0.6 or 0.8 mm; 300 or 224 continuous transverse slices) and a sagittal 3D fluid-attenuated inversion recovery sequence (TE/inversion time/TR=4700/1600/290 or 5000/1800/413 ms; field of view=260 × 234 or 250 × 250 mm; matrix size=512 × 460 or 261 × 261; number of excitations 2 or 1; slice thickness 0.55 or 1.0 mm; 340 or 176 continuous transverse slices).
CCA Measurement
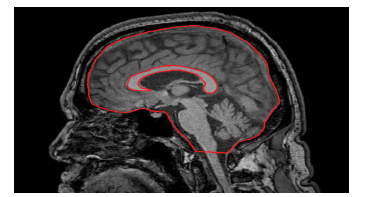
The CCA was manually outlined on a sagittal midline T1-weighted sequence with a picture archiving communication system (PACS) by a neurologist (SA). The CCA was normalized to the intracranial skull surface area on the same image (Figure 1). To test the robustness of the normalized CCA (nCCA), intra-rater reliability was measured at a second rating session 6 months later, and inter-rater agreement was studied by comparing the ratings of other examiners (TO and RK). All MRI ratings were performed in a randomized manner, with examiners blinded to the clinical assessments and assessments of the other examiners.

Figure 1: Techniques for the manual measurement of the corpus callosumarea and intracranial skull surface area on midline T1-weighted magnetic resonance imaging sequence.
MRI Data Analysis
The volumes of the brain parenchyma, cortex, thalamus, hippocampus, putamen, globus pallidus, caudate, and cerebellum were analyzed using FreeSurfer software version 7.1.1 (https:// surfer.nmr.mgh.harvard.edu/). We also obtained the estimated total cranial volume (eTCV), which was normalized to the eTCV. In addition, the MS lesion volumes were measured using SPM software version 12 (https://www.fil.ion.ucl.ac.uk/spm/) and Lesion Segmentation Toolbox version 3.0.0 (https://www. applied-statistics.de/lst.html), a special software for MS lesion segmentation. We obtained lesion masks of the whole brain using Lesion Segmentation Toolbox and found lesion volumes that were normalized to eTCV. If necessary, all segmentations were visually assessed and manually edited by the author (SA).
Statistical Analysis
All statistical analyses were performed using Easy R (EZR) software version 1.54 (Saitama Medical Center, Jichi Medical University, Saitama, Japan), which is a graphical user interface for R version 4.0.3 (The R Foundation for Statistical Computing, Vienna, Austria) [20]. The Mann-Whitney U test and Fisher’s exact test were used to compare demographic data between the CI and cognitive normal (CN) groups. Logistic regression analyses were conducted to assess the differences between the CN and CI groups. Spearman’s rank correlation coefficient was used to evaluate the correlations of MRI markers with the MoCA score and EDSS. Correlation analyses were performed after adjusting for age, sex, disease duration, and type of MRI scanner. Correlation coefficients (r) of 0.2-0.4, 0.4-0.6, 0.6-0.8, and 0.8-1.0 were considered weak, moderate, strong, and very strong, respectively [18]. Intra-rater and inter-rater agreement analyses were performed using the intraclass correlation coefficient (ICC). ICC values of <0.40, 0.40-0.75, and >0.75 were considered poor, fair to good, and excellent, respectively, based on statistical convention [18]. Because of the exploratory nature of the study, the threshold for significance among statistical tests was set at p<0.05. Receiver operating characteristic (ROC) curves were drawn for 10 MRI markers, along with the optimal cutoff value, sensitivity, specificity, and area under the curve (AUC). The Youden index was calculated for all parameters.
A total of 136 patients with MS were retrospectively reviewed in this study. Their demographic characteristics are summarized in Table 1. Among these patients, 62 were classified into the CI group, whereas 74 were classified into the CN group. There were no significant differences in age, sex, or disease duration between the two groups. EDSS was significantly higher in the CI group. Additionally, fewer patients with relapsing remitting MS were included in the CI group than in the CN group. The inter-rater and intra-rater ICC for nCCA were excellent (0.91 and 0.94, respectively; both p<0.01).
| CN group (n=74) | CI group (n=62) | ||||
|---|---|---|---|---|---|
| Mean (SD) | Median (IQR) | Mean (SD) | Median (IQR) | p-value | |
| Age, years | 44.2 (11.1) | 44.5 (13.75) | 46.2 (10.4) | 47.0 (9.75) | 0.27 |
| Sex, n, females/males | 53/21 | 37/25 | 0.15 | ||
| EDSS | 3.61 (1.92) | 3 (3.0) | 5.45 (2.01) | 6 (3.38) | <0.001 |
| Disease duration, years | 11.86 (8.52) | 11 (11.0) | 14.19 (9.00) | 12 (15.5) | 0.12 |
| Subtype in MS, n, RR/SP/PP | 56/15/3 | 25/29/8 | <0.001 |
Note: CI, cognitive impairment; CN, cognitive normal; EDSS, Expanded Disability Status Scale; PP, primary progressive; RR, relapsing-remitting; SP, secondary progressive
Table 1: Demographic data of patients with multiple sclerosis.
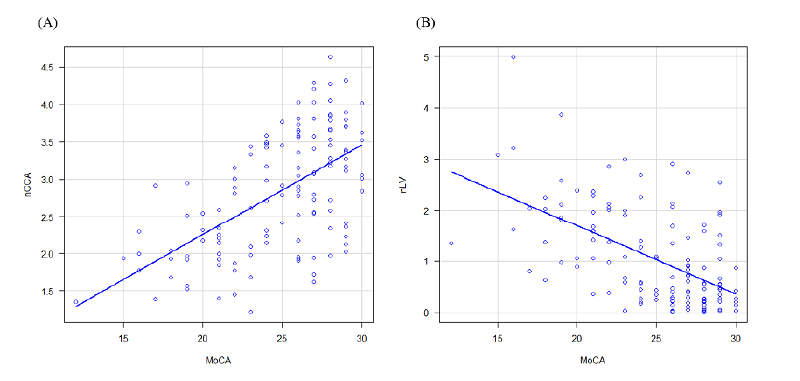
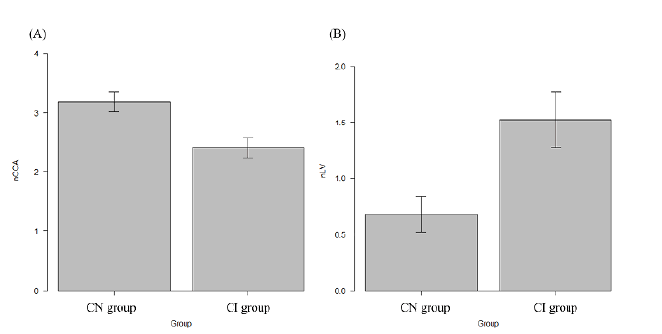
The results of the MRI analysis are presented in Table 2. The nCCA showed a moderate correlation with the MoCA score (ρ=0.56; p<0.001), as shown in Figure 2. The normalized lesion volume (nLV) also showed a moderate correlation (ρ=- 0.49; p<0.001). Weak correlations were noted between the MoCA score and the normalized volumes of the brain parenchyma (ρ=0.32; p<0.001), cortex (ρ=0.20; p=0.02), thalamus (ρ=0.33; p<0.001), putamen (ρ=0.35; p<0.001), globus pallidus (ρ=0.28; p<0.05), and caudate (ρ=0.28; p<0.05). No significant correlation was observed between the normalized hippocampal volume (ρ=0.09; p=0.29) and normalized cerebellar volume (ρ=0.075; p=0.40). The nCCA was strongly correlated with nLV (ρ=-0.61; p<0.001). The results of the group comparisons are summarized in Table 3. In the CI group, the nCCA was 24.5% lower than that in the CN group, and the nLV was approximately 2.2 times higher than that in the CN group, as shown in Figure 3.
| CN group (n=74) | CI group (n=62) | ||
|---|---|---|---|
| Mean (95% CI) | p-value |
||
| nCCA | 3.18 (3.01-3.35) | 2.40 (2.22-2.58) | <0.001 |
| nLV | 0.68 (0.52-0.84) | 1.52 (1.26-1.78) | <0.001 |
| Normalized brain parenchyma volume | 72.0 (69.9-74.1) | 68.4 (66.2-70.5) | <0.05 |
| Normalized cortex volume | 41.93 (40.80-43.06) | 40.66 (39.5-41.8) | 0.18 |
| Normalized thalamus volume | 0.90 (0.86-0.94) | 0.82 (0.78-0.86) | <0.05 |
| Normalized cerebellum volume | 9.16 (8.93-9.39) | 9.00 (8.70-9.30) | 0.61 |
| Normalized hippocampus volume | 0.53 (0.51-0.55) | 0.51 (0.49-0.53) | 0.32 |
| Normalized putamen volume | 0.58 (0.55-0.61) | 0.50 (0.47-0.53) | <0.05 |
| Normalized globus pallidus volume | 0.25 (0.24-0.26) | 0.23 (0.23-0.24) | <0.05 |
| Normalized caudate volume | 0.42 (0.40-0.44) | 0.39 (0.37-0.41) | 0.11 |
Note: nCCA, normalized corpus callosum area; nLV, normalized lesion volume; CI, confidence interval
Table 2: Normalized corpus callosum area and volumetric measurements.

Figure 2: Scatterplots between MoCA and nCCA as well as nLV.
| Correlation with the MoCA score, ρ, p | Correlation with EDSS, ρ, p | |
|---|---|---|
| nCCA | 0.53, <0.001 | -0.23, <0.05 |
| nLV | -0.49, <0.001 | 0.38, <0.001 |
| Normalized brain parenchyma volume | 0.33, <0.001 | -0.17, 0.053 |
| Normalized cortex volume | 0.20, 0.02 | -0.13, 0.14 |
| Normalized thalamus volume | 0.33, <0.001 | -0.24, <0.05 |
| Normalized cerebellum volume | 0.075, 0.40 | -0.06, 0.51 |
| Normalized hippocampus volume | 0.09, 0.29 | -0.07, 0.45 |
| Normalized putamen volume | 0.35, <0.001 | -0.21, <0.05 |
| Normalized globus pallidus volume | 0.23, <0.05 | -0.11, 0.22 |
| Normalized caudate volume | 0.28, <0.05 | -0.21, <0.05 |
Note: nCCA, normalized corpus callosum area; nLV, normalized lesion volume
Table 3: Correlations of MRI markers with the MoCA score and EDSS.

Figure 3: The nCCA and nLV in MS.
Correlation analyses between the EDSS and MRI markers were also performed. The nCCA, nLV, normalized thalamus volume, normalized putamen volume, and normalized caudate volume showed only a weak correlation. As for all MRI markers, the correlation with the EDSS was weaker than that with the MoCA score.
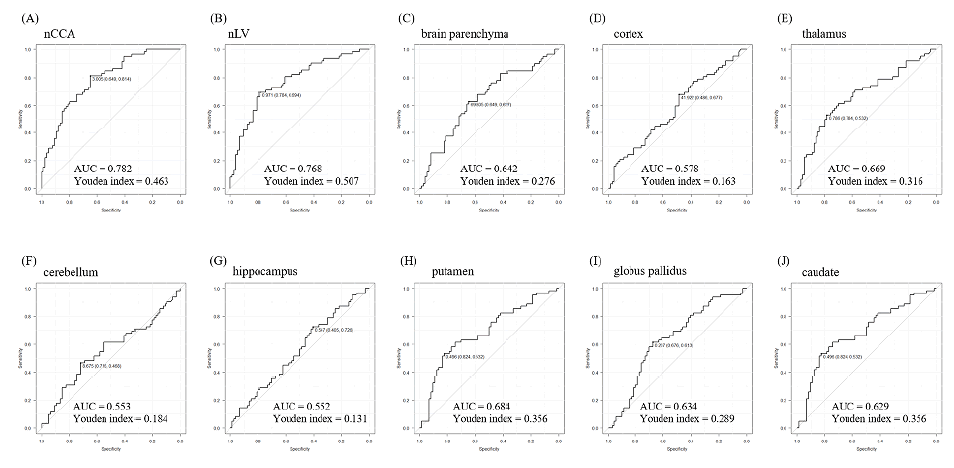
The ROC curves for individual MRI markers are presented in Figure 4. Among all MRI markers, the nCCA showed the largest AUC and had the second highest Youden index, following the nLV. The Youden index of the nCCA was almost equal to that of the nLV (0.463 vs. 0.507).

Figure 4: Receiver operating characteristic (ROC) curves for the MRI markers.
The present study revealed that the nCCA was significantly correlated with the MoCA score. The correlation coefficient for the nCCA was the highest among the MRI markers. In the ROC analysis, the nCCA showed the highest AUC and had the second highest Youden index. Compared to other markers, the nCCA is highly feasible because volumetric approaches are not required; the nCCA can be measured within a shorter time using a routine imaging system alone, such as the PACS. This marker can avoid several problems associated with volumetry, such as inaccurate segmentation and parcellation of brain structures. In addition, the inter-rater and intra-rater ICC suggested the robustness of this indicator. Furthermore, the nCCA yields continuous values as clinical indicators, which are considered sensitive to detect subtle changes in the disease progression and potentially applicable to the therapeutic trials of disease modifying drugs. Therefore, the nCCA may be a promising MRI biomarker of CI in patients with MS.
In the present study, we obtained the optimal cutoff value of nCCA, which showed moderately high sensitivity (81.4%) and specificity (64.9%). To the best of our knowledge, the cutoff value of the CCA for CI in MS has not been reported. Only one report, which showed that the nCCA was correlated with CI of MS, did not provide the optimal cutoff value of nCCA [7]. The cutoff value allowed for differentiating patients with cognitive impairment from those with normal cognition in the clinical setting. Furthermore, volumetric measurements are dependent on the types and settings of MRI scanners, software used for MRI analyses, and methods of analyses; for example, the outcomes of FreeSurfer and SPM software were affected by the type of MRI scanners [21]. The cutoff value of nCCA may provide universal results because the nCCA could be measured using an extremely simple technique and may be easily translated into clinical practice.
We selected MoCA as a neuropsychological battery because it was routinely used in our hospital. MoCA was not the best option but was considered a screening tool for CI in MS [22,23]. In fact, the MoCA score was correlated with the normalized brain parenchyma volume, suggesting that MoCA can be used in the initial assessment of CI in MS.
The mechanisms of corpus callosum atrophy in MS have not been elucidated; nevertheless, there are several potential explanations for the reduction in the CCA. The corpus callosum has rich reciprocal connectivity with the brain and may be particularly susceptible to secondary degeneration due to MS lesions in the cerebral white matter. This explanation was supported by our results that the nCCA was strongly correlated with the nLV, as well as previously reported findings that fibers passing through the corpus callosum were injured in MS [24]. In addition, MS lesions in the corpus callosum, one of the favored sites of MS plaques, may also cause corpus callosum atrophy. Therefore, MS lesions in the cerebral white matter and corpus callosum may play an important role in corpus callosum atrophy.
The reason why cognitive dysfunction develops in MS remains unclear. Many patients with MS show plaques in the corpus callosum, but callosal disconnection syndrome is usually rare in MS [25], implying that direct damage to the corpus callosum may have a weaker effect on cognitive dysfunction. A study showed that disconnection of cognitively important processing regions, including the corpus callosum, was the main cause of cognitive dysfunction in MS [24]. Accumulation of MS lesions could cause disconnection of multiple cognitively relevant tracts, resulting in cognitive dysfunction and atrophy of anatomical structures with rich reciprocal connectivity with the brain.
The nCCA and some of the MRI markers were also correlated with the EDSS, an indicator of physical dysfunction; nonetheless, these correlations were much weaker than the correlation between the MRI markers and MoCA score. One of the reasons may be that physical dysfunction is usually affected by lesions both in the brain and spine. This may suggest that the MRI markers that we analyzed were more sensitive to cognitive dysfunction than to physical dysfunction.
Other MRI markers, including normalized volumes of the brain parenchyma, cortex, thalamus, putamen, globus pallidus, caudate, and lesions, were significantly correlated with the MoCA score. These results are consistent with the findings of previous reports [8,10,26], demonstrating the reliability of this study. The nLV showed the second highest correlation, following the nCCA, and relatively large differences between the groups. This suggests that a simple visual inspection of the lesions and corpus callosum may provide useful supporting evidence to predict cognitive performance in patients with MS in the clinical setting.
Our study had several limitations. First, this was a single-center study in Japan, and the results might have been influenced by selection bias. Second, we used a single test for cognitive assessment. This may be associated with reduced robustness. Third, MoCA was used as a cognitive battery. In MS, dysfunction of information processing is the main cognitive problem, and MoCA is not an appropriate battery for predicting impairment in information processing. To overcome these limitations, we should perform a prospective study using appropriate neuropsychological batteries such as the Symbol Digit Modalities Test.
In conclusion, we found that, among 10 MRI markers, the nCCA showed the strongest correlation, followed by the nLV. The nCCA may be a reliable, easy to use, and robust biomarker of CI in MS. Large scale, multi-institutional studies are warranted to confirm the clinical usefulness of the nCCA, which may establish a sensitive surrogate marker to evaluate the clinical effects of disease modifying drugs.
Data are available on reasonable request.
The authors declare no conflict of interest.
This research received no specific grant from any funding agency in the public, commercial, or not for profit sectors.
The authors thank Editage (www.editage.com) for English language editing.
[Crossref] [Google Scholar] [Pubmed]
[Crossref] [Google Scholar] [Pubmed]
[Crossref] [Google Scholar] [Pubmed]
[Crossref] [Google Scholar] [Pubmed]
[Crossref] [Google Scholar] [Pubmed]
[Crossref] [Google Scholar] [Pubmed]
[Crossref] [Google Scholar] [Pubmed]
[Crossref] [Google Scholar] [Pubmed]
[Crossref] [Google Scholar] [Pubmed]
[Crossref] [Google Scholar] [Pubmed]
[Crossref] [Google Scholar] [Pubmed]
[Crossref] [Google Scholar] [Pubmed]
[Crossref] [Google Scholar] [Pubmed]
[Crossref] [Google Scholar] [Pubmed]
[Crossref] [Google Scholar] [Pubmed]
[Crossref] [Google Scholar] [Pubmed]
[Crossref] [Google Scholar] [Pubmed]
[Crossref] [Google Scholar] [Pubmed]
[Crossref] [Google Scholar] [Pubmed]
[Crossref] [Google Scholar] [Pubmed]
[Crossref] [Google Scholar] [Pubmed]
[Crossref] [Google Scholar] [Pubmed]
[Crossref] [Google Scholar] [Pubmed]
[Crossref] [Google Scholar] [Pubmed]
[Crossref] [Google Scholar] [Pubmed]
Citation: Akaike S, Okamoto T, Kurosawa R, Lin Y, Sato W, et al. (2023) Corpus Callosum Area: A Reliable and Feasible Neuroimaging Marker of Cognitive Impairment in Multiple Sclerosis. Clin Psychiatry. 9:006.
Copyright: © 2023 Okamoto T, et al. This is an open-access article distributed under the terms of the Creative Commons Attribution License, which permits unrestricted use, distribution, and reproduction in any medium, provided the original author and source are credited.