Keywords
Force plate; balance disability, diagnosis, strain gauge; centre of pressure; force, moment
Introduction
Balance is one of the most important physical and mental skills playing a crucial role in sport performance,
rehabilitation procedure and even human daily life activities. Many evidences have examined different methods,
especially mental trainings to improve this ability in athletes and patients [1,2]. A decrease in the quality of balance
can also be related to additional fall-risk factors that are manifested by their effect on balance, such as visual,
vestibular or proprioceptive problems. A commonly used method is to identify elderly with balance problems [3].
Traditionally, there are many simple ways available to measure various parameters involving body balance.
Masoumeh Hashemi1 et al., 2012, used a T-shaped bar for this purpose. The task for the test subject was to stand on
one leg, chosen by him, on the T-shaped balancing bar for 1 minute. The number of contacts made with the ground
is counted. The variable used for analysis was the number of ground contacts of the leg being held up during the 1
minute [4].But as it is observed, these old methods provide very simple and limited parameters, whereas force plates
are very accurate devices which provide the researchers and clinicians with exact position of center of pressure as
well as ground reaction force and free moment vectors. The main method used to evaluate balance is clinical tests
such as the Tinetti Balance Scale [5] or using a force plate (FP) to analyse the sway [6].
A force plate is mainly an instrument for measuring ground reaction force [7]. This instrument need such a device,
called a force transducer, to make the accurate measurements. A force transducer gives an electrical signal
proportional to the applied force. There are many kinds available: strain gauge, piezoelectric, pizoresistive,
capacitive and others. All these work on the principle that the applied force causes a certain amount of strain within the transducer [8].Typically, force platforms are used in biophysics and athletics applications to study the forces
involved in human or animal locomotion [9,10]. Usually this is done by observing the Ground Reaction Forces
(GRF) at the Centre of Pressure (CoP) [11]. The most simplistic force plates are essentially bathroom scales, and
only calculate the normal component of the GRF at the geometric centre of the plate [12]. The most advanced force
plates can calculate all three components (not just the normal) of the GRF at the CoP, as well as a number of torques
about either the CoP or the geometric centre of the plate [13].
Force plates use load cells to read forces. Load cells use what are called strain gauges, which essentially are variable
resistors that change their resistance relative to their strain (basically how much they stretch) [14]. By measuring the
resistance, and calibrating each load cell so that the resistance is meaningful in proportion to force, you can use
linear algebra and some knowledge of statics to figure out what the torques, CoP, and GRF are.
The base design of our force plate is an exciting departure from the ordinary. Typically, force plates are constructed
with load cells, all with their axes vertical, supporting a plate. This standard design is adequate for applications
where you need the centre of pressure and the normal force, but is a poor choice for applications dealing with shear
forces [15]. In such applications, shear forces will apply off-axis loads on the load cells. Off-axis loads can result in
incorrect data from the load cells, which are usually designed only to read forces along their axes. Off-axis loads can
also result in damage to load cells.
To solve this problem, we consider building a force plate based on a Stewart platform design [16]. Stewart platforms
have 6 support struts between the ground or some other immobile object, and a top plate or platform. Instead of
terminating in six different points, the support struts terminate on the ground and plate in sets of two, resulting in
three termination points on both the ground and the top plate.
Our design replaces the support members with six load cells, allowing us to gather data in six degrees of freedom. It
also has the added benefit of keeping all of the loads axial along the load cells. Although some stiffness is sacrificed
in the system because the support members/load cells are not completely vertical, the effects are essentially
negligible.
Materials and Methods
The fabrication of force plate has five individual parts: 1) Mechanical design, 2) Electrical design 3) Firmware, 4)
Software and 5) Calibration. The integrity of these parts helped us to have a superior instrument.
A. Mechanical Design
This force plate which its sensitive area is a 40 cm- diameter circle is based on the standard Stewart Platform
hexapod design, with the six legs attached, in pairs, to three points on each plate. This provides a perfectly
constrained system, fixing plates in relation to each other in all three translational axes and all three rotational axes.
With the load cells mounted in the centre of each of the legs, we are able to read the forces and the torques in all
directions through axial loads on the load cells (Figure 1).
Figure 1: The standard Stewart Platform with loadcells placed in the moddle of axes
Each of the plates has a multi-layer structure with totally 5 mm thickness to provide proper stiffness. This structure
is used to pretend the deflections of to por bottom plates during applying loads to the force plate. Any deflection in
the plates will cause the energy to get absorbed into deforming the plate rather than the load cells. Since the load cell
readings are directly based on the deformation of the load cell frame, this will lead to inaccuracies in our force
readings. According to above, preventing the bending in top and bottom plates under outward forces applied to the brackets, were really considered in our designing and fabricating process. To help remedy this problem, we added a
reinforcing plate and brackets between the plates to fix the two plated together rigidly. That way when a large,
outward force is applied to the brackets, it would try to bend the top/bottom plate, but the reinforcing plate would be
placed in tension. Aluminium is much stronger against tension in comparison to bending, so this would lead to a
much stiffer system.
Our original design had a ball and socket joint attaching each of the legs to mounting brackets mounted in a triangle
on each plate. These joints allowed the legs of the force plate to align them at the appropriate angle. Since the ball
and socket joints had the ability to rotate in all three axes, the angle of the legs would be able to change as the plate
deformed. This ensured the loads being all along the load cells axes, thus eliminating off-axis noise. But, it also
would allow the angle of the forces to change potentially invalidating our model. Although we felt that the effects of
either of these factors would be minimal at best, we considered the minimizing the off-axis loading of the load cells
as a more important factor, and that sold us on this design (Figure 2).
Figure 2: The flexure joints used to connect the axes
Unfortunately, the provided socket joints had a lot of "slop" in them. This could cause the readings on the force plate
to be inaccurate, so we had to redesign the force plate to incorporate a "slopless" mounting system. We were
suggested to look into flexure joints to adjust the angle rather than ball and socket joints. Flexure joints rely on the
natural flexibility in the metal to adjust the angles of each leg. Unfortunately these joints are not nearly as flexible as
the ball and socket joints, only being able to move a couple of degrees (without excessive forces being applied,
which would cause off-axis loading problems on the load cells). This means that we needed to create a mounting
block with the holes for the flexure joints perfectly aligned with the load cells. Because of the complex angles
involved, this block would have to be made with the 4th axis on a CNC mill.
Designing the flexure joints was a tricky matter. They needed to be flexible enough to reduce the off-axis loading to
insignificant levels, yet still strong enough not to break as a person jumped on the force plate. To design the flexure
joints properly, we used Cosmos Works (a FEM software package) to model the physical response to differing loads.
Using this data, we settled on a design that was above the endurance limit of our material as well as flexibility and
strength.
B. Electrical Design
We utilized six 250 kg- S type load cells made by Zemic Company in this force plate. The original circuit is no more
complicated than an AD624 instrumentation amplifier in line with each load cell. The resulting amplified signal was
fed through a 9-conductor serial cable to a breakout box, and finally to a PCMCIA data acquisition card which fed
data to a laptop computer for manipulation in MATLAB.
For ease of prototyping and time constraints, the circuitry is implemented on a pair of solderless breadboards. Since
solderless breadboards are designed for easy insertion and removal of components, impacts to the projects boxes
containing the breadboards could cause components to come loose. Additionally, the 50-pin data acquisition card
connection was attached using 30 AWG wire, and we had to solder 22 AWG solid core wire to the end of it in order
to actually stay in the breadboard. Unsurprisingly, we kept losing connection between the 50-pin data acquisition
card connector and the breadboard.
Additionally, the PCMCIA data acquisition card we were using was inadequate for its intended purpose. Due to age
and repeated use, the data output from the data acquisition card has become very noisy and unreliable.
Because of the problems with the data acquisition card and the breadboards, it was decided that we should move to a
PIC microcontroller as an ADC, and a PCB to replace the breadboards.
Since the PIC runs on a 0-5V range, and the output of the AD624s (as configured) ranged from -7.2V to 7.2V, we
needed to re-enter the output of the AD624s around 2.5V with a maximum of 5V and a minimum of 0V. We were
able to accomplish this using a resistor tree. By connecting a 20k resistor to 5V, a 65k to GND, a 28.8k to the signal
from the AD624s and tying the other ends of the resistors to the input pin on the PIC, we were able to re-centre the
output signal around 2.5V. These resistor values were chosen very carefully to have an apparent resistance of 10k
between the signal and the input to the PIC. This 10k resistance was used with a 0.022uF capacitor in a RC filter
circuit to attenuate signals with a greater than 1kHz frequency, as to filter out any EMI or RFI from outside sources
(Figure 3 & 4).
Figure 3: The block diagram of the electrical board used for driving the load cells and making data acquisition
Figure 4: The electrical board used for driving the load cells and making data acquisition
C. Firmware
The firmware for the forceplate is very simple. Essentially all it does is enumerate the PIC as a USB device, and sets
up the PIC to do analogue to digital conversion for all six load cells. As part of the USB interface, the firmware has
several vendor specific requests which do nothing more than requesting the 10-bit value for each load cell, which
correspond to each load cell's voltage.
D. Software
The point of having software on the computer for this project is to do all of the complicated (for a PIC anyway)
linear algebra manipulations on a platform that actually has a FPU, and of course the whole GUI thing.
To calculate the forces along the Cartesian axes, we just project the forces of each load cell on the axes. Then all the
components summed to obtain the net forces along the axes. To obtain the exact position of the CoP on the force
plate, it is necessary to modify the equations regarding that the subject will stand on top of the plate, just 5 mm
higher than the interception points of the load cells because of the thickness of the top plate (Δh).
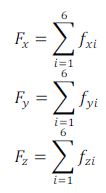 Eq. 1: Components of the ground reaction force vector
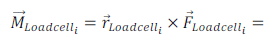 Eq. 2:Moment produced by each load cell force
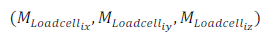
 Eq. 3: Components of Total Moment of applied forces exerted to back side of the top
plate.
Eq. 3: Components of Total Moment of applied forces exerted to back side of the top
plate.  is the free torque of the force platform.
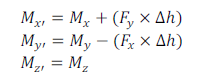 Eq. 4: Modified components of moment regarding the thickness of the top plate.
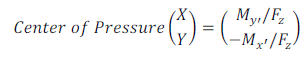 Eq. 5:Calculation of CoP position
Where Fx, Fy & Fz are the net forces applied to the forceplate along the x,y and z axes respectively.
In order to calculate the moments and CoP, we are taking the following steps:
I. Chose the reference point on the top plate,
II. Calculate the moments on horizontal plate,
III. Modify the moments by considering the thickness of plate,
IV. Obtain the position of CoP,
V. Return to the first step
The original software was written using MATLAB. It served its purpose admirably, the problem was with the data
acquisition card, so we had to scrap it and move to another solution.
Since one of the major goals was to port the force plate over to USB, a different platform for the host code had to be
found. The most logical choice was Python due to its large number of freely available modules and its ease of use in
designing and implementing GUIs.
The first hurdle to the software development was the desire to implement real time data collection. This problem
offers two main challenges. First, it is very difficult to calculate the exact time that a computer calculation will take
since it is dependent on what else the computer is doing at the time. If this problem could not be solved, we would
still be able to collect data in real time, but we would not be able to match each data point with the time that it
occurred. Fortunately, Python offers a solution to this problem. Python contains a module called time which, when
called, returns the time at which the function call was issued. This enabled us to implement real time data collection.
The second challenge offered by real time data acquisition is the problem of frame rate. Most plotting packages
offered by Python have relatively low refresh rates, on the order of 10 FPS. This is not nearly high enough to
produce the desired resolution in our data. We went through three different plotting utilities before we found one
that was able to more reasonably meet our resolution requirements by offering 18 FPS resolution. After some
optimization of the GUI code by reducing the amount of data that needed to be refreshed each cycle, the resolution
was again increased to 24 FPS. If plotting in real time is not necessary, it can be turned off and frame rates of around
40 FPS can be reached.
E. Calibration
The final step of manufacturing the force plate was calibration. A standard method provided by Barrett et al, 1987
[16] and Mita et al, 1993 [17], was utilized for this purpose. First we measured the exact plates dimensions and
thicknesses very accurately since they are inserted to the equations. Then, we levelled the top and bottom plates
since they should be completely paralleled. The spatial accuracy was measured by placing different magnitudes of
calibrated loads on the co-ordinate of interest. The loads were then removed and reapplied on the next co-ordinate of
interest. This was repeated for up to 40 co-ordinates, which gave an adequate representation of the coordinates of the
top plate for the range of loads between 7 kg- 30 kg. Finally, due to the results, some modifying coefficients were
added to our equations to eliminate the undesired offsets.
Results
The results that the system provides mainly include GRFs, CoP and the free torque of the plate. Also indications
such as the total amount of Z-directed fore, placement of the COP on the plate in percent, oscillation amplitude of
COP in sagital and frontal planes, sway index (SI), speed rate of COP displacement in sagital and frontal planes, the
total area of COP displacement (Figure 5 (a-c)) are to be calculated and reported . Besides, the software will show the
ground force vector in three dimension as well as the moments. Tests could be done in two conditions (static and
dynamic modes).
Figure 5: Force plate output sample
Some of indices calculated by the software is shown
Parts of the comprehensive reports of the system are presented here. The subject could perform the rehabilitation
tests which will improve individual capability in decreasing the falling risk.
Discussion and Conclusion
In this paper, we present designing and fabrication of force plate. The force plate system presented here could be
used in various medical applications; these measurements may be a part of the evaluation of the action of particular
drugs which influence the central nervous system. Furthermore, these kinds of measurements may be applied to individuals with diverse cerebral deficiencies Hallet et al. [18] summarized abnormalities in stabilometric findings in
connection with some cerebral diseases.
On the other end of the spectrum of applications of force plate measurements are investigations of postural stability
and gait pattern in top athletes. In such studies, relationship between body stability and performing different skills
are investigated under conditions similar to those normally encountered during training and competition.
Moreover, as this system provides real time results, it could be used as a biofeedback for postural training purposes.
Hence, this posturographic measurement platform is both clinical and research equipment which has applications in
medical and research centers.
Adding frequency spectrum and nonlinear analyses might be a useful option that will be added to the software in
future.
References
- Froogh Abiri Bonab, Roghaye Mohammadi and Zhila Balegh. European Journal of Experimental Biology. 2013, 3(2):631-634.
- Sonia Esmaeelzadeh, Hasan Mohammadzadeh and Elnaz Imanzadeh. European Journal of Experimental Biology.2013, 3(3):489-491.
- A.M. Studiorum, PhD thesis, University of Bologna, (Bologna, Italy, 2012).
- Masoumeh Hashemi1, Lida Dehghani, Reza Saboonchi, Mahdi Roozbahan and Alireza Roonasi. European Journal of Experimental Biology. 2012, 2 (3):786-791
- Tinetti ME, Speechley M, Ginter SF. New England Journal of Medicine, 1988, 319: 1701-1707.
- Centers for Disease Control and Prevention. Self-reported falls and fall-related injuriesamong person aged ≥ 65 years-United States, Morbidity and Mortality Weekly Report, 2008, 57(09): 225-229.
- M. J. Adrian and J. M. Cooper, Biomechanics of Human Movement, 2nd ed. Brown and Benchmark, Madison, Wisconsin, 1995.
- David. A. Winter; Biomechanics and Motor Control of Human Movement, Third Edition, John Wiley And Sons, INC, Waterloo, Ontario, Canada,2005.
- R. M. Alexander, The Human Machine. Natural History Museum Publications, London, 1992, pp. 59–87.
- R. M. Alexander, Exploring Biomechanics: Animals in Motion. Scientific American Library, W. H. Freeman, New York, 1992, 17–55.
- J. Rose and J. G. Gamble, Human Walking, 2nd ed. Lippincott Williams and Wilkins, Baltimore, 1996.
- R. Cross, Standing, Am. J. Phys. 1999, 67 (4).
- Iwan W. Griffiths, Principles of Biomechanics & Motion Analysis. Lippincott Williams & Wilkins, Baltimore,2006.
- S.H. Collins, P. G. Adamczyk, D. P. Ferris, A. D. Kuo. Gait Posture. 2009, 29(1):59-64.
- G. Bergmann, F. Graichen, A. Rohlmann, P. Westerhoff, B. Heinlein, A. Bender, R. Ehrig. J Biomech Eng. 2008, 130(2):021009.
- R. Barrett, S.A. Hyde, W.B. Hark, Journal of Med. Eng. And Tech, 1987, 11: 68 – 73.
- Mita, K.A. Kataki, K. Itoh, H. Nogami, An Investigation of the Accuracy in Measuring the Body Centre of Pressure in a Standing Posture with a Force Plate, Frontiers of Medical Biological Engineering, 1993, 5: 201-13
- Majidifakhr K, Kazemirad S, Farahmand F. Stud Health Technol Inform. 2009,142:177-9.