Research Article - (2023) Volume 7, Issue 3
Development of Chronic Kidney Disease Risk Prediction and Management System: Research Study
Bheema Lingaiah Thamineni1*,
Abeba Getachew Asmare1,
Hanumesh Kumar Dasari2 and
Solomon Woldetsadik1
1Department of Biomedical Engineering, Jimma University, Jimma, Ethiopia
2Department of Electronics and Communication, Rayalseema University, Kurnool, India
*Correspondence:
Bheema Lingaiah Thamineni, Department of Biomedical Engineering, Jimma University, Jimma,
Ethiopia,
Email:
Received: 09-May-2023, Manuscript No. IPACN-23-17683;
Editor assigned: 12-May-2023, Pre QC No. IPACN-23-17683 (PQ);
Reviewed: 26-May-2023, QC No. IPACN-23-17683;
Revised: 01-Sep-2023, Manuscript No. IPACN-23-17683 (R);
Published:
29-Sep-2023, DOI: 10.35248/2471-8505-7.3.21
Abstract
Background: Chronic kidney disease is one of a major global public health issue, affecting over 10% of
the population worldwide. It is the leading cause of death in 2016 ranking 16th and is expected to rise
to 5th rank by 2040. Consequently, tools to identify patients at high risk of having CKD and
management of risk factors are needed, particularly in limited-resources settings where laboratory
facilities are scarce. This study aimed to develop a risk prediction and management system using data
from JUMC, SPHMMC and MTUTH.
Objective: To develop chronic kidney disease risk prediction and management system is using expert
system.
Method: General chronic kidney disease risk factor were collected from expert knowledge. The
identified general risk factors were applied on 384 patients data collected from three hospitals to
identify risk factors in Ethiopia. The risk factors were identified using statistical analysis. After
identifying the risk factors from the statistical analysis, risk factor managements techniques were
identified from expert knowledge. Knowledge gained from the expert knowledge and statistical
analyses were combined and developed using rule based expert system.
Main outcome measure: Accuracy, precision and recall are the parameters which have been
evaluated from the developed system using confusion matrix.
Result: The system has showed 63.3%, 65.3% and 77.5% accuracy at 14%, 24% and 34% cut off
percent respectively in estimating probability.
Conclusion: This study will have significance in preventing chronic kidney disease at early stage and
creating awareness.
Funding statement: The authors received no specific funding for this study.
Keywords
Chronic kidney disease; Diabetes and hypertension; Glomerulonephritis; Decreased birth
Abbreviations
AOR: Adjusted Odd Ratio; ACR: Albumin Creatinine Ration; BMI: Body Mass Index;
BUN: Blood Urea Nitrogen; CA: Chronic Kidney Affected; CKD: Chronic Kidney Disease; COR:
Common Odd Ratio; CVD: Cardio Vascular Disease; DKD: Diabetic Kidney Disease; DM: Diabetes
Mellitus; GFR: Estimated Glomerular Filtration Rate; ESRD: End Stage Renal Disease; FP: False
Positive; FN: False Negative; ROC: Receiver Operating Characteristic; GFR: Estimated Glomerular
Filtration Rate; HDL: High Density Lipoprotein; HTN: Hypertension; JUMC: Jimma University Medical
College; KFRE: Kidney Failure Risk Equation; KDIGO: Kidney Disease Improving Global Outcomes;
MDRD: Modification of Diet in Renal Disease; MVLR: Multi Variable Logistic Regression; MTUTH:
MizanTepi University Teaching Hospital; NC: Not Affected; RL: Risk Level; RM: Risk Management;
SPHHMC: Saint Pauls Hospital Millennium Medical College; SPSS: Statistical Package for the Social
Sciences; SBP: Systolic Blood Pressure; TP: True Positive; TN: True Negative; UACR: Urine Albumin
Creatinine Ratio; WC: Waist Circumstance
Introduction
Chronic Kidney Disease (CKD) is one of a major global public
health issue, affecting over 10% of the population worldwide
and is defined as an abnormality of kidney function or
structure for 3 months. The problem is the leading cause of
death in 2016 ranking 16th and is expected to rise to 5th rank
by 2040. In developed countries, the prevalence of moderateto-
severe CKD (stages G3-G5) in population representative
surveys is estimated at 5%-6%. Due to the significant increase
in non-infectious disease (particularly diabetes and
hypertension), CKD is rapidly increasing in developing
countries. Furthermore, infectious diseases, such as HIV,
schistosomiasis and leishmaniasis, which also contribute to
CKD, are highly prevalent in low-income to middle-income
countries [1]. Although there is no generalized data on the
prevalence of CKD in Ethiopia, a study done prevalence on of
chronic kidney disease among public hospitals in Addis Ababa
showed that stage (1-2) prevalence of CKD is 27.2%, (15.6%
and 11.6%) respectively. Whereas stage (3-4) prevalence of
CKD is 34.1%, (19.4% and 14.7%) respectively, 26% prevalent
among diabetes mellitus and hypertensive patients of Jimma
university medical center and 21.8% prevalent among diabetic
adults at university of Gondar hospital. The leading causes of
chronic kidney disease in all developed countries are diabetes
and hypertension. Glomerulonephritis and unknown causes
are more mutual in countries of Asia and sub-Saharan Africa.
These differences are related mainly to the burden of disease
moving away from infections toward chronic lifestyle-related
diseases, decreased birth rates and increased life expectancy
in developed countries [2].
However, the onset and progression of CKD is frequently
preventable. The primary level of prevention requires
awareness of modifiable CKD risk factors and efforts to focus
healthcare resources on those patients who are at the highest
risk of developing new onset. Populations or individuals at
CKD risk must be diagnosed and treated early to prevent the
onset of and delay the progression of the kidney disease [3].
Management of CKD risk factors is also needed for prevention
CKD. In addition, aggressive risk factor reduction should be
carried out in individuals at increased risk for CKD even when
the disease is not clinically apparent. Real prevention policies count on an accurate understanding of the incidence and
prevalence of CKD in a given setting, as well as the
distribution and burden of risk factors. Despite the known
adverse consequences of CKD, the vast majority of the people
remain unaware of the disease that kidney disease can be
diagnosed with simple laboratory procedures [4]. However,
people’s practice toward testing (screening) themselves to
know the status of CKD is exceptionally very low. Further,
awareness of CKD remains unacceptably low among care
providers. A study done on awareness of chronic kidney
disease among adult diabetic outpatients in Northeast
Ethiopia showed that there is a high prevalence but low
awareness of CKD in diabetic outpatients attending the health
center [5].
Prediction models are important to identify high risk
subgroups for chronic kidney disease. These models enhance
the ability of health care providers to prevent or delay serious
sequelae, including kidney failure. In order to identify risk high
risk individuals different models are developed for different
countries. A study done on Peru people developed risk score
using risk factors and laboratory-based variables [6]. This
study included sex, age, hypertension and cholesterol level as
independent variable. They developed two risk scores for
prevalent undiagnosed CKD: Complete and a laboratory-free
risk score. The complete and laboratory-free risk scores
performed similarly well with a ROC area of 76.2% and 76.0%.
Another study done by Heejung Bang developed a simple
prediction model using adult participants in the national
health and nutrition examination surveys in United States.
Socio-demographic factors, health conditions were included
in the statistical analysis. Similarly, another study done on
American population developed prediction system that can
estimate the probability of CKD. This model includes socio
demographic factors, laboratory tests, health status and
lifestyles. Evaluation of the final model of the study resulted
in 86% sensitivity, 85% specificity, 18% positive predictive
value and 99% negative predictive value [7].
A study developed using Canadian cohorts of patients
developed a predictive model for progression of chronic
kidney disease to kidney failure. They showed that a model
using routinely obtained laboratory tests can accurately
predict progression to kidney failure in patients with CKD stages 3 to 5 utilizing demographic, clinical and laboratory
data from 2 independent Canadian cohorts of patients with
CKD stages 3 to 5 (estimated GFR, 10-59 mL/min/1.73 m2).
Statistical analysis was used to identify significant factors. In
the validation cohort, this model was more accurate than a
simpler model that included age, sex, estimated GFR and
albuminuria. Additional research which was done also
established and validated a risk prediction model for endstage
renal disease in patients with type 2 diabetes, which
included retrospective cohort study consisting of 24,104
Chinese patients with type 2 diabetes [8]. This study
developed 3, 5, and 8-year ESRD risk scores with good
prediction accuracy and discriminatory ability. Another study
also developed predictive model for progression of chronic
kidney disease to kidney failure. This model used a large
administrative claims database. patients ≥ 18 years of age and
continuously enrolled for 36 months. Multivariate logistic
regression was also used to develop the model. The strongest
predictors of progression to kidney failure found during this
study were CKD stage (4 and 3), HTN and DM. The developed
system is intended to identify patients in a large
administrative claims database with CKD stages 3 or 4 who
were at high risk for progression to kidney failure [9].
Similarly, additional study has combined renal risk factors into
scoring systems that can be used to assess renal risk in
individual patients. An approach they used are decision-tree
simulation and Bayesian modeling to assess risk and this has
been practiced to determine individual risk of ESRD in a
hypothetical population of USA patients using blood pressure
and a measure of proteinuria as well as basic demographic
data [10]. Similarly, Masaki Makino, et al., depicted
that artificial intelligence can predict the progression of
diabetic kidney disease using big data machine learning.
This new predictive model using AI could detect the
progression to DKD, which may contribute to more
effective and accurate intervention to reduce hemodialysis
and cardiovascular types. The risk prediction models has
identified risk factors and utilized them for risk prediction in
the form of scoring [11].
The developed models focus solitary on one specific country
and can’t be applied for Ethiopia because of difference in risk
factors. Additionally, the developed risk prediction models do
not recommend management of risk factors. Consequently;
this work aimed at developing CKD risk prediction and
management system using expert system. General chronic
kidney disease risk factor were collected from expert
knowledge. The identified general risk factors were applied on
384 patients data collected from JUMC, SPHMMC and MTUTH
to identify risk factors in Ethiopia [12]. The risk factors were
identified using statistical analysis. After identifying the risk
factors from the statistical analysis risk factor managements
techniques were identified from expert knowledge. Rule
based expert system was developed using knowledge gained
from the expert knowledge and statistical analyses. To
validate the developed system confusion matrix was used and
the system has showed 63.3%, 65.3% and 77.5% accuracy at
14%, 24% and 34% cut off percent respectively in estimating
probability of having CKD.
Materials and Methods
The overall methodology for the achievement of the research
included knowledge acquisition, data collection, data analysis,
risk factor management technique identification,
expert system development and performance evaluation. Figure 1 shows general methodology of the study [13].

Figure 1: General methodology of the research.
Knowledge Acquisition
Study variable needed for this study were gained from expert
knowledge. Different variables were identified from CKD
guidelines and articles related to risk factor identification and
diagnosis methods. Different studies have been done on CKD
risk factors and also some nephrologist has published
different common risk factors. In this study research articles
and guidelines were reviewed and variables applicable to
Ethiopia were identified. The identified risk factors were older
age, sex, diabetes mellitus, hypertension, body mass index,
injury on kidney, presence of family with the disease,
cigarette use, alcohol consumption, being hospitalized before
and related kidney diseases.
Data Collection
In order to distinguish the risk factors in general people in
Ethiopia, data was collected from selected population by
preparing questionnaire using the variables identified from
expert knowledge and previous studies format as reference.
The data collection has included different steps. Figure 2 shows methods undertaken for the successes of data
collection.

Figure 2: Data collection block diagram.
Sample Size Determination
The sample size needed was calculated on the basis of the
following equation (1), single proportion formula with a 95%
confidence level, standard deviation=5, 5% margin of error.
The values were selected on the basis of fulfilling the criteria
for performing logistic regression analysis [14].

Where
Z=95% confidence level,
Std. dev=Standard deviation=0.5
A margin of error (confidence interval)=± 5%
((1.96)2 × 0.5 (0.5))/(0.05)2
(3.8416 × 0.25)/0.0025
0.9604/0.0025
384.16
384 respondents.
Setting and Population
This data collection was conducted from March 4 to June 14,
2021 at the inpatient settings Jimma university medical
center, St Phaulos Millenium medical college and MizanTepi
university teaching hospital. The hospitals were selected using
purposive sampling [15]. In purposive sampling researcher
decides which particular groups to select. Purposive sampling
is used when it is challenging to reach every area, household
or individual member of the population and dependable
information about population locations and numbers is not
available. Additionally it is used when there is insufficient time
to visit the number of households or individuals needed. Due
to lack of time and budget these sampling was used to select
the hospitals [16].
As humans were involved in the study, the study protocol is
performed in accordance with the relevant guidelines. All
subjects involved in the study were invited to participate on a
voluntary basis. A written informed consent is obtained from
all the participants with age 18 and above, who were suspect
of CKD and admitted to the hospital were eligible for the
study. Age above 18 is selected because it is preferred to
perform studies for age above 18 because, they cannot
provide their consent and information needed by themselves
without help of their parents and some of the questions are
related with addiction (smoking and chat consuming) they
may not provide the right answer [17]. A total of 384 patients
who fulfilled the above criteria were consecutively included
for the final analysis. Socio-demographic and some risk factor
variables were collected using a structured questionnaire by
five nurses. Patient histories were reviewed to identify
presence and absence of CKD, HTN, DM, kidney related
disease and other diseases. Creatinine data was obtained
from patient history and the Glomerular Filtration Rate (GFR)
was estimated using Modification of Diet in Renal Disease
(MDRD) study equation shown in 2 and stage of CKD was
identified using KDIGO guideline [18].

Measures
The height and weight were taken at the time of the interview
and used to measure the BMI. Participants were categorized
by BMI into normal (BMI 18.5-24.9), underweight (<18.5),
overweight (25.0-29.9), obese (30.0-39.9) and morbid obese
(≥ 40.00) according to guidelines. Participants were
considered to have diabetes mellitus if previously they had
been recognized by the doctor as having DM or any
documents in favor of DM or they reported taking insulin or
oral anti-diabetic drug or random plasma glucose ≥ 11.1
mmol/L with symptom. Blood pressure readings have been
obtained by a qualified nurse using an electronic
sphygmomanometer. Hypertension was defined as systolic BP
≥ 140 mmHg or diastolic BP ≥ 90 mmHg or use of medication
for hypertension irrespective of the blood pressure [19].
Statistical Analysis
A set of methods used to analyze data are called statistic.
Statistic exists in all areas of science involving the collection,
handling and sorting of data, given the insight of a specific
phenomenon and the possibility that, from that knowledge,
inferring possible new results. One of the goals with statistics
is to extract information from data to get an improved
understanding of the situations they represent. Thus, the
statistics can be thought of as the science of learning from
data [20]. In other way, we can say that statistic based on the
theory of probability, provides techniques and methods for
data analysis, which help the decision-making process in
various problems where there is uncertainty (Figure 3).

Figure 3: Flow chart of data analysis.
As shown in Figure 3, statistical analysis was performed using
version 26 of the SPSS. The first approach done before
analyzing data was entering and editing the data. Data was
entered in the form of number and string. In order to identify
missing values missing value analysis using frequency analysis
was performed. Patient data containing incomplete
information were excluded/corrected before performing the analysis. After data entry and missing value analyses,
descriptive analyses, bivariate analyses and multivariable
logistic regression were performed. Descriptive analysis was
performed to identify participant’s socio demographic status
and stage.
Bivariate analysis was performed to identify differences in
patient’s characteristics and risk factors for CKD were
analyzed using chi-square test. Chi-square test is used to
determine whether the association between two qualitative
variables is statistically significant, since researchers must
conduct a test of significance. Additionally, In order to
estimate the unique relationship between the included
variables and CKD status multivariable logistic regression was
performed. Multivariable Logistic Analysis (MVLA) model is
selected because it is efficient method for the analysis of with
one outcome (dependent) and multiple independent
variables. In this study CKD status is taken as dependent
variable while other factors are taken as independent
variable. In statistical analysis to identify the significance of
the independent variable P value is the taken as a
measurement tool. The P stands for probability and measures
how likely it is that any observed difference between groups is due to chance. Being a probability, P can take any value
between 0 and 1. Values close to 0 indicate that the observed
difference is unlikely to be due to chance, whereas a P value
close to 1 suggests no difference between the groups other
than due to chance. The smaller is the probability of the result
being “statistically significant” (p-value<0.05 or <5%). In this
work P value is taken P<0.05 for MVLRA and bivariate analysis.
In multivariable analysis, male gender (AOR=2.297; 95% CI:
1.407-3.753), hypertension (AOR=3.095; 95% CI: 1.882-5.089),
family history of kidney disease (AOR=4.128; 95% CI:
2.302-7.402), diabetes above ten and below ten years
(AOR=30.986; 95% CI: 3.972-241.744), COR=3.011; 95% CI:
1.904 (1.212-7.483) respectively, hypertension (AOR=3.60;
95% CI: 1.98-6.54), smoking above 4 years (COR=2.226; 95%
CI: 1.014-4.883), being overweight and injury on kidney
(COR=1.904; 95% CI: 1.904 (1.119-3.239) (AOR=2.362; 95% CI:
1.016-5.491) were independently associated with the
presence of CKD. Tables 1 and 2 shows relation between the
variables from bivariate and MVLRA analysis.
| Variables |
Frequency |
Percentage |
COR (95% CI) |
P value |
| CA (%) |
NCA (%) |
| History of HTN |
Yes |
151 |
51 |
49 |
1.861 (1.419, 2.440) |
0 |
| No |
233 |
27 |
72 |
0.675 (0.570, 0.798) |
| Diabetes duration ≥ 10 |
Yes |
30 |
96.7 |
3.3 |
27.528 (3.788, 200.057) |
0 |
| No |
354 |
47.5 |
52.5 |
0.857 (0.808, 0.909) |
| Duration<10 |
Yes |
38 |
78.9 |
48.3 |
3.559 (1.675, 7.561) |
0 |
| No |
346 |
21.1 |
51.7 |
0.885 (0.828, 0.946) |
| Sex |
Female |
169 |
38.5 |
61.5 |
0.590 (0.464, 0.749) |
0 |
| Male |
215 |
61.4 |
38.6 |
1.509 (1.251, 1.820) |
| Age |
Age ≥ 60 |
64 |
54 |
46 |
1.113 (0.895, 1.385) |
0.335 |
| Age<60 |
320 |
49 |
51 |
0.913 (0.760, 1.098) |
| History of smoking |
Duration>4 |
51 |
74.5 |
25.5 |
2.775 (1.527, 5.041 |
0.001 |
| Duration<4 |
333 |
47.7 |
53.3 |
0.867 (0.802, 0.938) |
| Chat consumption |
Yes |
54 |
46.3 |
53.7 |
0.818 (0.498, 1.344) |
0.427 |
| No |
330 |
52.1 |
47.9 |
1.033 (0.953, 1.121) |
| Hospitalized before |
Yes |
115 |
44.3 |
55.7 |
0.756 (0.556, 1.030) |
0.075 |
| No |
269 |
54.3 |
45.8 |
1.127 (0.987, 1.286) |
| Experienced injury |
Yes |
40 |
72.5 |
27.5 |
2.503 (1.288, 4.864) |
0.005 |
| No |
344 |
48.8 |
52.2 |
0.906 (0.846, 0.970) |
| Presence of family with kidney disease |
Yes |
92 |
69.9 |
30.4 |
2.170 (1.460, 3.225) |
0 |
| No |
292 |
45.5 |
54.5 |
0.794 (0.708, 0.890) |
| Affected with CVD |
Yes |
49 |
40.8 |
59.2 |
0.655 (0.384, 1.116) |
0.116 |
| No |
335 |
42.8 |
42.8 |
0.670 (0.566, 0.793 |
| BMI |
| Normal |
Yes |
85 |
44.7 |
55.3 |
0.767 (0.526, 1.120) |
0.167 |
| No |
299 |
52.2 |
44.8 |
1.078 (0.968, 1.200) |
| Underweight |
Yes |
48 |
54.2 |
36.8 |
1.122 (0.659, 1.908) |
0.671 |
| No |
336 |
50.9 |
49.1 |
0.984 (0.912, 1.061) |
| Over weight |
Yes |
127 |
61.1 |
38.9 |
1.875 (1.372, 2.563) |
0 |
| No |
257 |
44 |
56 |
0.745 (0.646, 0.859) |
| Obese |
Yes |
6 |
50 |
50 |
0.949 (0.194, 4.644) |
0.886 |
| No |
378 |
51.4 |
48.6 |
1.001 (0.949, 1.462) |
| Other kidney disease presence |
Yes |
8 |
25 |
75 |
0.316 (0.065, 1.548) |
0.133 |
| No |
376 |
51.9 |
48.1 |
1.023 (0.993, 1.053) |
| Alcohol consumption |
Yes |
18 |
72.5 |
27.5 |
2.468 (0.897, 6.788) |
0.069 |
| No |
366 |
50.3 |
49.7 |
0.960 (0.918, 1.003) |
Table 1: Crude odd ratio of factors associated with CKD of respondents from bivariate analysis.
| Risk factor |
Significance P values |
Final model AOR (95% CI) |
Final model B0 coefficient (intercept=-1.836) |
Low risk |
High risk |
| Diabetes duration ≥ 10 |
0 |
30.986 (3.972, 241.744) |
3.434 |
Has no diabetes |
Diabetes above 9 years |
| Presence of family with kidney disease |
0 |
4.128 (2.302, 7.402) |
1.14 |
Without presence of family with kidney disease |
Has family with kidney disease |
| Hypertension |
0 |
3.095 (1.882, 5.089) |
1.13 |
Has no diabetes |
Has no hypertension |
| Diabetes duration<10 |
0.018 |
3.011 (1.212, 7.483) |
1.102 |
Has no diabetes |
Diabetes between 0 and 9 years |
| Experienced injury around kidney |
0.046 |
2.362 (1.016, 5.491) |
0.86 |
Has not experienced injury |
Experienced injury |
| Sex |
0.001 |
2.297 (1.407, 3.753) |
0.832 |
Female |
Male |
| Smoking |
0.046 |
2.226 (1.014, 4.883) |
0.8 |
Below 4 years |
Above 4 years |
| Over weight |
0.018 |
1.904 (1.119, 3.239) |
0.644 |
Underweight and normal |
Overweight |
Table 2: Adjusted odd ratio and p values of factors associated with CKD of respondents from multivariable logistic regression analysis.
Expert System Development
The Expert System (ES) is a computer system that emulates
the decision-making ability of a human expert in a limited
domain. The expert system is one of the leading Artificial
Intelligence (AI) techniques that have been adopted to handle
such task. ES provide powerful and flexible means for
obtaining solutions to a variety of problems that often cannot
be dealt with by other, more traditional and orthodox
methods. In this research rule based expert system is
developed to make a system that can predict risk of
individuals and suggest management ways. Figure 4 shows
general frame work of the developed expert system.

Figure 4: General frame work of the system.
Rule Based Expert System
Rule-based expert systems use rules as a knowledge
representation technique. If and then statements are used to
present rules. The “if” part is called premise, the “then” part
is called conclusion. The data and associated conditions are
the fact elements. Facts interact with data directly to
determine if the event is of interest. The rule component of
the expert systems relates facts with actions. In other words,
it constructs an if-then rule by putting the facts under the if
part and the set of actions under the then part. Through,
joining rules using logical operator’s complex rules can be
formed. AND and OR operators are used to form premise part
of the rule. A rule can also activate multiple set of actions.
These set of actions can also be joined by logical operators
when there are multiple set of facts to be checked
individually. Basic structure of expert system contains
knowledge base, inference engine and user interface.
Knowledge base contains domain-specific and high-quality
knowledge. Inference engine gets and uses the knowledge from the knowledge base to reach at a specific solution. It
applies rules repetitively to the facts, which are obtained from
earlier rule application. It adds new knowledge into the
knowledge base if required. Resolves rules conflict when
multiple rules are applicable to a particular case use of
efficient procedures and rules by the inference engine are
essential in deducting a correct, flawless solution. To
recommend a solution, the inference engine uses forward
chaining and backward chaining. Forward chaining systems
are data-driven rule-based systems that trigger actions based
on the facts under the premise part of the rule. They start
from the known data and add a new fact to the knowledge
base, if it is not already in the knowledge-base. The
disadvantage with forward chaining is many rules can be
executed even they do have nothing to do with the
established goal. So it is not efficient if one fact is only to be
inferred. Forward chaining systems perform well when the
goal is not known. They can trigger sounding actions if
adequate information is gathered. User interface offers
interaction between user of the ES and the ES itself.
Knowledge Acquisition for Expert System
Risk prediction knowledge acquisition: In order to make a
system that can predict a risk of CKD knowledge must be
attained and stored as set of rules. For the risk prediction the
knowledge from different literature reviews and expert was
analyzed on the patient’s data to identify the relationship
between the disease and significant factors. The identified risk
factors from the MVLA are used for risk prediction. Identified
risk factors can be used for estimating probability of disease
using logistic regression equation shown in equation 3 below
and to identify risk level. For a factor that increases risk, the
probability of disease when the factor is present exceeds that
in absence of the characteristic. Logistic regression models
can account for the joint effects of multiple factors on the
occurrence of disease. The multivariable logistic model
provides an estimation of risk for subsequent disease. The risk
level is identified with presence and absence of risk factor
which can be classified as low risk and high risk.
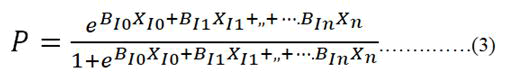
Where, P is the probability of CKD during a stipulated period
of observation, where B0 is the intercept, B1 is the regression
coefficient for the first independent variable (x1), B2 is the regression coefficient fo r th e second independent variable
(x2) and so forth for each of the variables.
Risk Factor Management Technique Identi ication
Identifiable risk factors of CKD can be classified as modifiable
and non-modifiable risk factors. Some of the risk factors
found in this study are modifiable. Hypertension, diabetes
and BMI, are factors that are part of metabolic syndrome.
Even though cigarette smoking is not a component of
metabolic syndrome, it is also a known modifiable risk factor.
Interventions that delay and prevent the onset of diabetes
mellitus, reduce overweight, support smoking cessation and
control hypertension should be considered to improve to
prevent or delay CKD. Genetics related factors, gender and
injury are not modifiable. After identifying related risk factors
from the statistical analysis risk management ways are
searched for from different guidelines for modifiable risk
factors like DM, HTN, smoking and being overweight. For nonmodifiable
risk factors male gender, experiencing injury,
presence of family members were excluded as they can’t be
modified. For the modifiable risk different guidelines were
reviewed and identified.
Knowledge Representation
In these research work, rule based expert system is
developed. The facts gained from different guidelines, books
and statistical analysis were stored as facts and implemented
using rules by means of ‘’if‘’ and ‘’then’’ cases. The proposed
expert systems reasons based on different health
implications, socio demographic status and health
implications and generate three types of results. Taking these
questions as an input, the expert systems trigger the
inference engine to fire probability of the disease, risk level
and management suggestion. The system asks different
health implications; socio demographic status and habits
gained from MNLRA. As shown below in Figure 5 Q0 represent
age. Q1-Q9 represents question that will be asked from the
user, B represents values for each question, the questions
include presence of DM, duration of diabetes, presence of
HTN, habit of smoking, duration of smoking, height, weight,
presence of family history with CKD and experience of injury.
For questions that need duration, it asks the duration if the
person has the disease otherwise it takes it as “No”. If the
answer of each question is “Yes”, the B value is set to a
number greater than zero which is found from logistic
regression unless B value is set to zero and probability of the
person is calculated using logistic regression formula. If the
person has one risk factor, the system identifies the risk level
as high risk individual. If no risk factor is found, it identifies as
low risk. In addition, if the person has modifiable risk factor, it
suggests risk factor type the person has and how it should be
managed (Figure 5).

Figure 5: Algorithm of the system.
Graphical User Interface
Tkinter library and Azure theme (GU styling) is used for
creating an application of user interface, to create windows
and all other graphical user interface. Python programing tool
is also used to write the code.
Performance Evaluation Metrics
After the system is built, its performance must be evaluated
so as to know the actual result. The system was evaluated
using data extracted from medical records of patients at
JUMC. Medical records of 120 patients containing 60 patient’s
data with CKD and 60 without CKD were collected for
evaluation and patients were interviewed. To evaluate the
system, all data was organized exported to the developed
system and the system output was compared with the
diagnosis recorded in the medical records. The system is
evaluated using confusion matrix. The confusion matrix is a
square matrix table that is used to describe the performance
of any classification models on test dataset by representing
the actual (column) and predicted (row) dimensions. It makes
it easy for programmers to clearly see the performance of the
model designed. A number of model performance metrics can
be derived from the confusion matrix. Perhaps, the most
common metric is accuracy defined by the following formula,
precision and recall. The evaluation was performed at three
cut off percent’s.
Accuracy = TP+TN/TP+TN+FP+FN…………….(4)
Other performance metrics include precision and recall
defined as follows:
Precision=TP/TP+FP…………….(5)
Recall=TP/TP+FN…………………(6)
Results
A TP (True Positive) value indicates that what is predicted is
true; A TN (True Negative) value indicates that the predicted
class is truly negative. A FP (False Positive) value indicates that a thing is predicted as if it is part of the class while it is not, FN
(False Negative) the prediction indicates that it is not part of
the class while it is. Table 3 shows the results of the evaluation of the risk prediction system at different three cut
off percentages.
| Cut off probability percent |
Recall |
Precision |
Accuracy |
| 14 |
96.6 |
58 |
63.3 |
| 24 |
98.3 |
59.5 |
65.3 |
| 34 |
83.3 |
74.6 |
77.5 |
Table 3: Performance evaluation result.
The risk factor management techniques are shown below in Table 4 from the reviewed guidelines and different articles.
| Risk factors |
Management ways |
| HTN |
Stopping smoking |
| Reducing calorie intake |
| Reducing alcohol consumption |
| Performing regular dynamic exercise (such as brisk walking, swimming, cycling) |
| Taking medications given properly |
| DM |
Reducing alcohol consumption |
| Avoiding eating too much carbohydrate food |
| Choosing and preparing food and drinks with less salt, sugar, fat and oil |
| Staying as close as possible to schedule of eating, activity and medication |
| Setting goals with health care team for weight, activity, blood sugar level and A1C level |
| Checking blood sugar as directed and share tracking records with health care team |
| Ceasing smoking if you smoker |
| Overweight |
Limit energy intake from total fats and sugars |
| Increase consumption of fruit and vegetables |
| Engage in regular physical 150 minutes spread through the week for adults |
| Decrease energy density of foods and drinks |
| Decrease the size of food portions |
| Avoid snacking between meal |
| Do not skip breakfast and avoid eating in the night time |
| Manage and reduce episodes of loss of control or binge eating |
| Smoking |
Develop a plan to quit |
| Setting a quit date |
| Telling friends, family and coworkers. It is important to share goal to quit with those the smoker interact frequently |
| Anticipate challenges to the upcoming quit attempt |
| Remove tobacco products from environment |
Table 4: Risk factor management techniques.
Graphical User Interface (GUI) Implementation
Developed GUI was tested with respect to response time and
ease of use. It is found to be easy to use and is convenient for
users. Once initialized, result can be achieved within 2
seconds. The GUI has three options of the reasoning process
probability estimation, risk level and risk management
buttons. The probability estimation button part asks different
9 socio-demographic, habits, health implications questions
and it estimates probability of having the disease. Risk level
and management also has same questions to that of
probability estimation if the user hasn’t entered before. If the
user has not entered any question before the user is required
to enter questions for risk level and risk management. Risk
level displays the risk level and risk management also displays
management techniques for different cases. Figure 6 shows a
snap shot of the general layout of the developed GUI.

Figure 6: Front page of developed GUI.
Discussion
This study has assessed the factors of CKD among patients at
JUMC, SPHHMC, MTURH and developed risk prediction and
management system. Evaluation of final system for
probability estimation the prediction system has showed: At
cutoff point of 14% resulted in 96.6% recall, 58% precision
and 63.3% accuracy. At cutoff point of 24%, resulted in 98.3%
recall, 59.5% precision and 65.3% accuracy, at cutoff point of
34% resulted in recall 83.3%, precision 74.6% and 77.5%
accuracy. The accuracy of the model is not high because the
system estimates the probability of having the disease and
the system does not include laboratory measurements.
The previous models have included different variables in their
models. The developed system has shown variations from
these models, the models didn’t include family member,
being overweight, smoking presence, but in this study it was
found significant and included. As indicated above the risk factor variation maybe might be due to differences in
lifestyles such as dietary habit, sedentary way of life and
physical activities.
There are several potential implications of this work. First the
prediction system is combined from expert knowledge and
statistical analysis to identify the real effects of the risk factors
and this enables to identify the real phenomena. Secondly, by
allowing physicians to determine an individual’s estimated risk
for chronic kidney disease, the prediction may inform clinical
counseling and decision-making. For example, a higher
chronic kidney disease may weigh against a decision to use a
potentially interventions, favor increased intensity and
frequency of follow-up testing and assist in the decision to
institute renal primary prevention measures. The other is that
it can identify the individual’s risk without help of any
laboratory tests and engage them self’s for diagnosis and be
aware of risk factors. The third thing is that the system
provides management ways that can help patients reduce
their risk. As per our knowledge there is no prediction system
which has incorporated risk prediction and management,
which is key contribution on of the study. Finally, the
prediction system requires no prior laboratory tests to be
performed; it could be used for focused renal screening,
identifying individuals in whom creatinine measurement
should be considered. The limitation of this study is that it is
based only on three hospital’s patient data.
Conclusion
Chronic kidney disease is clinically silent in the early stages
resulting in most patients being detected shortly before, or
with, the onset of symptomatic disease. Identifying high risk
groups can help the clinicians and patients suspect the
disease early.
The research employed expert individual’s risk identification
method and statistical analysis to provide a system that can
identify risk of individual’s. The research also identified
related risk factors and showed their significance in risk
prediction. Additionally the study has also provided risk
management ways that enables user to identify their risk and
work on managing it. The system has shown 96.6% recall, 58%
precision and 63.3% accuracy at 14% cut off percent of
probability estimation. This may help individuals to know their
probability and engage themselves for screening.
Furthermore, clinicians also can use the system to identify
high risk individuals and suspect presence of CKD.
The key contribution of the study is that it’s performed on
general people and identified the risk factors. The other
contribution is that the system has utilized identified risk factors for self-risk prediction for the first time in Ethiopia and
developed management system which is new. As per, our
knowledge there is no a system which has incorporated risk
prediction and management.
Ethics Approval and Consent to Participate
Permission was obtained from two institutions one from,
Institutional Review Board (IRB) of St. Paul’s Hospital
Millennium Medical College (SPHHMC) with reference no: PM
23/34 dated 11.6.2021 and second is from Jimma university
institute of health institutional review board with reference
no JHRPEY/23/26 dated 20.4.2021. The consenting adults
participating in this study were at minimal risk. However,
participants were informed the purpose and duration of the
research. 100% waiver was obtained for this study since it was
for research purpose. We confirm that all methods were
performed in accordance with the relevant guidelines and
regulations.
Consent for Publication
Not applicable.
Availability of Data and Materials
The data sets used and/or analyzed during the current study
are available from the corresponding author on reasonable
request.
Competing Interests
The corresponding author declares that there is no conflict of
interest on the part of any of the other authors, including
themselves.
Funding
The authors received no specific funding for this study.
Author's Contribution
Abeba Getachew Asmare: Conceptualization, data curation,
analysis and interpretation of data, methodology, software,
validation, visualization, writing original draft, writing-review
and editing.
Bheema Lingaiah Thamineni: Conceptualization, formal
analysis, methodology, supervision, software, validation,
visualization, writing original draft, writing-review and editing.
Hanumesh Kumar Dasari: Formal analysis, critical revision of
the manuscript, investigation, resources, writing-review and
editing.
Solomon Woldetsadik: Data analysis, resources, investigation,
validation, writing-review and editing.
Acknowledgement
The authors of this study would like to acknowledge Jimma
university medical college, Saint Phaulos Millenium medical
college and Mizan Tepi teaching hospital for giving as the
opportunity to collect data of participants. Moreover, the
authors also would like to extend special thanks for
Nephrologist Meakel Belay, Dr. Melaku Tsediwu and Nurse
Kebede Temesgen for their guidance, support and advice.
Finally, the authors gratefully acknowledge Jimma university
school of biomedical engineering staffs for their support and
advice.
Ethical Consideration
The research data collection was approved by the institutional
review board of college of medicine and health sciences,
Jimma university and St Paulo’s Millennium medical college.
The purpose of the study was explained to the study
participants accordingly.
References
- Elshahat S, Cockwell P, Maxwell AP, Griffin M, O’Brien T, et al. (2020) The impact of chronic kidney disease on developed countries from a health economics perspective: A systematic scoping review. PloS One. 15(3):0230512.
[Crossref] [Google Scholar]
- Fraser SD, Blakeman T (2016) Chronic kidney disease: Identification and management in primary care. Pragmat Obs Res. 7:21-32.
[Crossref] [Google Scholar] [PubMed]
- Lv JC, Zhang LX (2019) Prevalence and disease burden of chronic kidney disease. Adv Exp Med Biol. 1165:3-15.
[Crossref] [Google Scholar] [PubMed]
- Luyckx VA, Tuttle KR, Garcia-Garcia G, Gharbi MB, Heerspink HJ, et al. (2017) Reducing major risk factors for chronic kidney disease. Kidney Int Suppl. 7(2):71-87.
[Crossref] [Google Scholar]
- Fisher MA, Taylor GW (2009) A prediction model for chronic kidney disease includes periodontal disease. J Periodontol. 80(1):16-23.
[Crossref] [Google Scholar] [PubMed]
- Carrillo-Larco RM, Miranda JJ, Gilman RH, Medina-Lezama J, Chirinos-Pacheco JA, et al. (2017) Risk score for first-screening of prevalent undiagnosed chronic kidney disease in Peru: The CRONICAS-CKD risk score. BMC Nephrol. 18(1):1-11.
[Crossref] [Google Scholar] [PubMed]
- Tangri N, Stevens LA, Griffith J, Tighiouart H, Djurdjev O, et al. (2011) A predictive model for progression of chronic kidney disease to kidney failure. Jama. 305(15):1553-1559.
[Crossref] [Google Scholar] [PubMed]
- Dai D, Alvarez PJ, Woods SD (2021) A predictive model for progression of chronic kidney disease to kidney failure using a large administrative claims database. Clinicoecon Outcomes Res. 13:475-486.
[Crossref] [Google Scholar] [PubMed]
- Taal MW (2011) Predicting renal risk in the general population: Do we have the right formula. Clin J Am Soc Nephrol. 6(7):1523-1525.
[Crossref] [Google Scholar] [PubMed]
- Makino M, Yoshimoto R, Ono M, Itoko T, Katsuki T, et al. (2019) Artificial intelligence predicts the progression of diabetic kidney disease using big data machine learning. Sci Rep. 9(1):11862.
[Crossref] [Google Scholar] [PubMed]
- Raghavan D, Holley JL (2016) Conservative care of the elderly CKD patient: A practical guide. Adv Chronic Kidney Dis. 23(1):51-56.
[Crossref] [Google Scholar] [PubMed]
- Cabrera VJ, Hansson J, Kliger AS, Finkelstein FO (2017) Symptom management of the patient with CKD: The role of dialysis. Clin J Am Soc Nephrol. 12(4):686-687.
[Crossref] [Google Scholar] [PubMed]
- Fiseha T, Tamir Z (2020) Prevalence and awareness of chronic kidney disease among adult diabetic outpatients in Northeast Ethiopia. BMC Nephrol. 21(1):1-7.
[Crossref] [Google Scholar] [PubMed]
- Kelly JT, Su G, Zhang L, Qin X, Marshall S, et al. (2021) Modifiable lifestyle factors for primary prevention of CKD: A systematic review and meta-analysis. J Am Soc Nephrol. 32(1):238-239.
[Crossref] [Google Scholar] [PubMed]
- Ji A, Pan C, Wang H, Jin Z, Lee JH, et al. (2019) Prevalence and associated risk factors of chronic kidney disease in an elderly population from eastern China. Int J Environ Res Public Health. 16(22):4382-4383.
[Crossref] [Google Scholar] [PubMed]
- Kazancioglu R (2013) Risk factors for chronic kidney disease: An update. Kidney Int Suppl. 3(4):368-371.
[Crossref] [Google Scholar] [PubMed]
- Naiker IP, Assounga AG, Meyers AM (2015) Diagnostic approach to chronic kidney disease. S Afr Med J. 105(3):236-236.
[Crossref] [Google Scholar] [PubMed]
- Ngendahayo F, Mukamana D, Ndateba I, Nkurunziza A, Adejumo O, et al. (2019) Chronic Kidney Disease (CKD): Knowledge of risk factors and preventive practices of CKD among students at a university in Rwanda. Rwanda J Med Health Sci. 2(2):185-193.
[Google Scholar]
- Ebrahimi Kalan M, Jebai R, Zarafshan E, Bursac Z (2021) Distinction between two statistical terms: Multivariable and multivariate logistic regression. Nicotine Tob Res. 23(8):1446-1447.
[Crossref] [Google Scholar] [PubMed]
- Gonzalez-Chica DA, Bastos JL, Duquia RP, Bonamigo RR, Martinez-Mesa J (2015) Test of association: Which one is the most appropriate for my study. An Bras Dermatol. 90(4):523-528.
[Crossref] [Google Scholar] [PubMed]
Citation: Thamineni BL, Asmare AG, Dasari HK, Woldetsadik S (2023) Development of Chronic Kidney Disease Risk Prediction
and Management System: Research Study. Ann Clin Nephrol. 7:21.
Copyright: © 2023 Thamineni BL, et al. This is an open-access article distributed under the terms of the Creative Commons
Attribution License, which permits unrestricted use, distribution, and reproduction in any medium, provided the original
author and source are credited.
Sources of funding : The authors received no specific funding for this study.