Research Article - (2024) Volume 10, Issue 3
Elucidating Electronic Structure Variations in Nucleic Acid-Protein Complexes Involved in Transcription Regulation Using a Tight-Binding Approach
Likai Du1* and
Chengbu Liu2
1School of Biological Information Engineering, Jinzhou Medical University, China
2Institute of Theoretical Chemistry, School of Chemistry and Chemical Engineering, Shandong University, China
*Correspondence:
Likai Du,
School of Biological Information Engineering, Jinzhou Medical University,
China,
Email:
Received: 24-May-2024, Manuscript No. IPBMBJ-24-20186;
Editor assigned: 27-May-2024, Pre QC No. IPBMBJ-24-20186 (PQ);
Reviewed: 10-Jun-2024, QC No. IPBMBJ-24-20186;
Revised: 17-Jun-2024, Manuscript No. IPBMBJ-24-20186 (R);
Published:
24-May-2024, DOI: 10.36648/2471-8084 10.03.21
Abstract
Transcription Factors (TF) are proteins that regulates the transcription of genetic information from DNA to messenger RNA by binding to a specific DNA sequence. Nucleic acid-protein interactions are crucial in regulating transcription in biological systems. This work presents a quick and convenient method for constructing tight-binding models and offers physical insights into the electronic structure properties of transcription factor complexes and DNA motifs. The tight binding Hamiltonian parameters are generated using the random forest regression algorithm, which reproduces the given ab-initio level calculations with reasonable accuracy. We present a library of residue-level parameters derived from extensive electronic structure calculations over various combinations of nucleobases and amino acid side chains from high-quality DNA-protein complex structures. As an example, our approach can reasonably generate the subtle electronic structure details for the orthologous transcription factors human AP-1 and Epstein-Barr virus Zta within a few seconds on a laptop. This method potentially enhances our understanding of the electronic structure variations of gene-protein interaction complexes, even those involving dozens of proteins and genes. We hope this study offers a powerful tool for analyzing transcription regulation mechanisms at the electronic structural level.
Keywords
Transcription Factor (TF); Nucleic acid-protein interactions; Tight-binding models; Electronic structure
properties; Transcription regulation
Introduction
Protein-DNA interactions play a crucial role in various biological
processes, such as gene regulation, transcription, DNA
replication, repair, and packaging [1-4]. For decades, the quest
to understand the intricate relationships between DNA and
proteins has been at the heart of biological research [5-10].
These nucleic acid-protein interactions usually occur in two
ways: Non-specifically, such as the interaction between histones
and DNA, and through highly selective, sequence-specific
binding, as seen in transcription factors. This distinction is
essential for numerous biological functions, ranging from gene
regulation to DNA repair [11]. Eukaryotic DNA is packaged into
nucleosomes (Figure 1) [12-15]. The Nucleosome Core Particle
(NCP) is the fundamental unit of DNA packing in eukaryotic
cells. It consists of an octamer of histone proteins around
which approximately 150 base pairs of DNA are bound [16-18].
The fundamental unit of DNA packing inside eukaryotic cells is
the Nucleosome Core Particle (NCP), in which approximately
150 base pairs of DNA are bound around an octamer of histone
proteins. Transcription Factors (TFs) act as mediators of genetic
information, directing the complex process of transcription,
in which DNA is transcribed into RNA, a precursor to protein
synthesis [6-10,19-21].
The Activator Protein-1 (AP-1) is a regulatory element that is
present in many promoter and enhancer regions. AP-1 plays a crucial role in regulating gene transcription across various
biological functions, highlighting its versatility in cellular
biology [22-25]. And it is characterized by the presence of a
highly conserved DNA binding domain that contains an N-×
7-R/K sequence and a basic leucine Zipper (bZip) domain [26-
32]. The relatively poorly conserved leucine zipper region is
characterized by leucine in the last position of every 7 amino
acids, and hydrophobic residues [28,33,34]. AP-1 proteins are
a versatile family of dimeric transcription factors. Jun protein
is a member of the AP-1 proteins. It has the ability to form
homodimers or heterodimers with other proteins. The c-Jun
protein promotes cell cycle progression by repressing the p53
tumor suppressor and activating cyclin D1. This reduces the
influence of the Cyclin-dependent Kinase Inhibitor (CDKI) p21,
facilitating the G1 to S phase transition [35-38].

Figure 1: The hierarchical structure of the chromosome organization with emphasis on transcriptional regulation, starting from the chromosome level, through chromatin and the nucleosome core particle, to the DNA helix. The atomic-resolution structures of the NCP and TF are also given
Exploring the impact of electron injection on DNA-binding
proteins is important in various research fields. Ultrafast
electron transfer occurs during the recognition of various DNA
sequences by a DNA-binding protein with distinct dynamic
conformations [39-44]. DNA damage and repair mechanisms
involve electron transport. For instance, positive charge transfer
can promote oxidative damage to guanine in DNA, which may
be related to the presence of mutation sites in the genome [45-
54]. DNA transcription factors such as SoxR and p53, which are
equipped with redox-active groups, use DNA charge transport
as a redox sensing mechanism [55-58]. The DNA-mediated
charge transport might enable signaling between the [4Fe4S]
clusters in the human DNA primase, polymerase α, and other
replication and repair high-potential [4Fe4S] proteins [59-63].
This DNA charge chemistry serves as both a sensing method
and a monitor of DNA integrity, which is sensitive to base
stacking perturbations caused by mismatches or DNA damage.
Quantum chemistry provides chemists with critical insight
into the electronic structure behavior of DNA or protein
molecules, but its extensive computational requirements
limit the scope and variety of systems that can be effectively
analyzed [64-68]. The Tight-Binding (TB) method offers a more
practical alternative for describing the electronic Hamiltonian
using smaller and more sparse matrices [69-74]. In early
work, the TB model was applied to materials science or solid
state physics. The TB model has been applied to molecular
clusters or biomolecular systems [75-81]. Traditionally, the
TB Hamiltonians have relied on empirical or semi-empirical
parameters, which raises concerns about their accuracy and
general applicability [82-89]. A few works are developed to
improve the accuracy and dependability of TB models through
the foundation of first-principles calculations [90-92].
The Protein Data Bank (PDB) has provided a continuous influx
of high-resolution structural data, which has significantly
advanced our understanding of protein-DNA interactions [93-
96]. The increasing number of high-quality experimental protein
and DNA structures, including those obtained through X-ray,
NMR, and cryo-EM techniques, have provided opportunities to
improve our TB parameters for biological systems. As previously
proposed, it is possible to derive TB parameters for millions or
even billions of molecular fragments, which represent most
occurrences in protein and DNA databases [92,97]. Integrating
structural insights, especially regarding residue preferences
in protein-DNA interactions, is essential for understanding
charge transfer mechanisms. Although accuracy is improved,
constructing the Hamiltonian is time-consuming due to the cost
of ab initio calculations and the projection step. Furthermore,
the resulting ab initio TB Hamiltonian is not transferable to
new structural configurations, which limits its usefulness for
electronic structure simulations. Nowadays, machine learning
algorithm in computational chemistry has been widely used
to predict interaction energies, molecular forces, electron
densities, density functionals and various molecular response
properties [98-114]. The machine learning algorithm can be
used to predict accurate TB Hamiltonian for unseen structures
during atomic structure explorations. Therefore, the machine
learning method for TB Hamiltonian parameterization is
desired.
In this work, we investigate DNA-protein interactions in
transcriptional regulation with a focus on transcription factors,
which regulate the transcription of genetic information
from DNA to messenger RNA by binding to a specific DNA
sequences. A comprehensive library of residue-level tight
binding parameters is constructed from detailed electronic
structure calculations. The library covers millions of nucleic
base and amino acid side-chain combinations extracted from
high-quality DNA-protein complex structures. TB Hamiltonian
parameters derived from ab-initio calculations are accurately
generated using a random forest regression algorithm.
Despite its simplifications, the direct diagonalization of the
TB Hamiltonian could generate various electronic structure
properties of DNA-protein complexes. Our approach quickly
reproduces the electronic structure details of orthologous
transcription factors, such as human AP-1 and Epstein-Barr virus
Zta, in seconds using a laptop [115,116]. We anticipate that our
study will serve as a powerful tool for analyzing transcription
regulation mechanisms at an electronic structural level. And
this methodology opens up possibilities for comprehending the
electronic structure variations observed in millions of proteingene
complexes or dozens of gene-protein complexes, in the
big data scenario.
Methods And Computational Details
Construction of the Nucleobase-Amino Acid
Library
The DNA-protein complexes contain only the 20 L-amino acids
and 4 deoxynucleotides, which are generally distinguished by
their different side chain structures and chemical compositions
(Figure 2). DNA-backbone interactions are the most numerous
and contribute to the stability of the DNA-protein complex. In
contrast, side-chain interactions of the protein are fewer but
confer specificity by recognizing the unique features of the
DNA sequence. The TB parameter library currently includes
collections of all possible combinations of amino acids and
nucleobases, specifically the Amino Acid/Amino Acid (AA),
Base/Base (BB), and Amino Acid/Base (AB) interaction patterns.
Our previous work has thoroughly studied the AA and BB
conformers, so this study will focus solely on the AB conformers
[92,97,117]. Note that the BB conformers in previous work
were generated from customized DNA models using packages
such as x3DNA [94]. In this work, we have updated the BB
conformers based on experimental DNA protein structures. The
procedure to extract each conformer from the available three
dimensional DNA binding protein structures follows the work
of Singh and Thornton [118]. This library comprises around
1.2 million conformers that cover a broad range of nucleic
acid sequences and protein families, ensuring representation
across different binding modes. The initial structures in the
library only contain the coordinates of the heavy atoms. The
missing hydrogen atoms were added using the tleap module in
the AmberTools package [119]. Three protonation states were
calculated for histidine, and 2 possible protonation states were
considered for other acidic and basic amino acids.

Figure 2: Illustration of one of the studied nucleobase-amino acid system (PDB ID: 2H7H), (a) Depiction of the nucleobaseâ??s phosphate group linked to a sugar ring, which in turn is bonded to a base. Adjacent is the general structure of an amino acid, with its variable side chain represented by "R" in a dashed outline, (b) Spatial distribution patterns of the interactions between the Cytosine base (CYT) from the nucleotide and the Glutamine (GLU) side chain. The clusters highlight various conformers
The Data Driven Tight Binding Model for
Biomolecules
The tight binding model is a robust framework for studying the
electronic properties of large and intricate molecular systems.
The foundational principles of the tight binding model for
molecule systems, including the derivation process, have been
detailed in previous publications from us or contributions
by others [92,97,117,120-122]. Here, we only describe our
methodologies for calculating on-site energies, charge transfer
couplings, and the Löwdin transformation in our current
research.
Biomolecules are composed of repeated structural units,
such as amino acids for proteins and nucleotides for DNA.
In the tight-binding approximation, electrons have limited
interactions with non-neighboring sites. The formulas for onsite
energy and transfer integral are provided below:
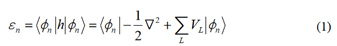
The summation runs over all possible sites L. However,
only the neighboring sites need to be considered in the TB
approximation. And ε represents the on-site energy and t
represents the transfer integral between sites. ψn refers to the
molecular orbital of one structural unit n. Therefore, the onsite
energy for site n only requires the potential information of
site n and its closest neighboring sites C. The formula for onsite
energy can be simplified as follows:
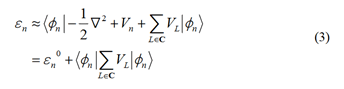
According to Equation 3, the on-site energy is not solely
determined by the orbital energy of site n; it also includes
contributions from adjacent sites, particularly the first set
of nearest neighbors, denoted as C. The model can take into
account the impact of neighboring residues on the on-site
energy.
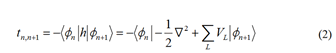
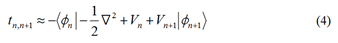
The transfer integral describes the ability to perform charge
transfer among neighboring sites, while the on-site energy
describes the ability to move or inject an electron from a
specific site. The transfer integral only require the potential of
site n and n+1, that is
In this work, we utilize the Löwdin method to minimize
orbital overlap, as the tight binding model corresponds to the
orthogonal basis. This enables us to transform the effective
transfer integral.
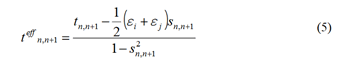
Equation 5 defines s as the orbital overlap integral between sites.
This transformation has minor effects on the on-site energy
and can be safely ignored if necessary. The TB parameters have
been extensively studied for pure DNA complexes and protein
complexes in the previous work [92,123].
In the framework of the tight binding Hamiltonian, the on site energy and transfer integrals are characterized as the
diagonal and off-diagonal matrix elements, respectively.
Diagonal elements correspond to the on-site energy for a
given orbital or site, which signifies the energy level of an
electron when it is localized at that site. Conversely, offdiagonal
elements quantify the transfer integral, indicative
of the probability of an electron’s transition between sites,
which is a measure of the charge transfer couplings within the
molecular system. Another practical difficulty is the inefficiency
in constructing the TB Hamiltonian from ab initio calculations.
Here, the Random Forest (RF) regression is utilized to predict
TB parameters within the BioTinter-1m framework. The RF
regression model is employed as a multi-input and multioutput
framework, enabling the simultaneous prediction of all
TB parameters [124-129]. This method constructs an ensemble
of decision trees from varied segments of the training data,
enhancing model diversity and robustness. Each decision tree’s
construction is guided by random subsets of features, enabling
nuanced learning from the dataset. The RF model averages
predictions across all trees to estimate molecular descriptors,
as implemented in the scikit-learn module in Python [130]. The
ensemble of 150 trees balances computational efficiency with
predictive accuracy.
Although various machine learning techniques were explored,
including deep learning methods, the findings indicate that
the performance of deep neural networks does not surpass
that of the RF model [111,131-135]. The limited success
observed in our studies with deep neural networks can often
be attributed to insufficient data in the training set. Although
our library contains millions of biomolecular residues, only a
few hundreds or thousands of conformers are available for
each type of AA, BB, or AB combination. Our initial test with the
deep neural network model implemented in PyTorch resulted
in a correlation coefficient below 0.92 and was therefore
not reported. In contrast, the RF model showed the lowest
correlations of 0.95 or higher (Table S1). Expanding the dataset
by a factor of 100 or 1000 could potentially enhance the
predictive capability of deep learning networks and improve
the overall understanding of biomolecular electronic structure
variations. In our preliminary evaluations, the deep neural
network model, implemented using the PyTorch framework,
exhibited the correlation coefficient of less than 0.91, which
did not meet our benchmark criteria for inclusion in this
study [136]. The RF model demonstrated relatively superior
performance, consistently achieving correlation coefficients
of 0.95 or above, as detailed in Table S1. We hypothesize that
augmenting our dataset by an order of magnitude, specifically
by factors of 100 to 1000, might significantly enhance the ability
of deep neural network to predict and thereby offer more
profound insights into the variability of electronic structures in
biomolecular systems.
After constructing the TB Hamiltonian, we can solve the wellknown
eigenvalue equation (HC=EC) directly for electronic
structure calculations of any bio-molecules. The electron-ion
dynamics can also be solved within the TB framework. These
methods are implemented in our in-house code BioTinter
(Tight-binding model for Biomolecular interactions). Because
this code carries a TB parameters library of 1.2 million
conformers, we would also refer to it as BioTinter-1m. The
workflow of BioTinter is shown in Figure 3.

Figure 3: Scheme 1: The workflow and code structure of BioTinter package used in this work
The BioTinter framework employs a layered architecture to
integrate TB parameters into quantum chemistry workflows,
significantly enhancing the computational efficiency and
accuracy of molecular simulations involving DNA-protein
complexes. At its core, the Database (DB) layer hosts an
extensive library of pre-calculated TB parameters. Absent
parameters trigger the Quantum Mechanics (QM) layer, which
calculates needed parameters via interfaces with Orca and
Gaussian to compute the requisite parameters [137,138]. This
process is augmented by the bioTB module, as detailed in our
preceding publications [92,97]. The Machine Learning (ML)
layer predicts TB parameters for novel conformers, enabling
the construction of the TB Hamiltonian for simulations. Initial
structural data for simulations are sourced from the Protein
Data Bank (PDB), MD trajectories, or tools like x3DNA and
AlphaFold [94,139]. BioTinter-1m prioritizes a balance between
speed and accuracy, resorting to on-the-fly QM calculations
when necessary. This on-the-fly module ensures that even with
a vast database, the system remains responsive and accurate.
The upcoming public release of BioTinter-10b may weaken
this on-the-fly module, as the conformer library is expected to
expand to 10 billion entries along with deep neutral network
model.
Simulation Details
In order to construct the TB parameters library, the positions of
hydrogen atoms were optimized for each dimer using B3LYP/6-
31G (d) calculations. We kept the coordinates of the heavy atoms
fixed during the optimization process. The on-site energies and
charge transfer couplings for each dimer are derived from at
the HF/6-31G (d) and B3LYP/6-31G (d) level according to the
idea of tight-binding approximation as our previous work
[92,97]. The solvent effects were considered with the implicit
solvation model if necessary. Quantum chemistry calculations
can be performed using either the Gaussian or Orca package,
both of which have been interfaced with BioTinter.
In the ML layer, the relative positions of molecules are described through their Internal Coordinates (IC), the Coulomb
Matrix (CM) and Smooth Overlap of Atomic Positions (SOAP)
descriptors. For a comprehensive understanding of CM and
SOAP descriptors, we recommend referring to existing literature
[140-143]. Our analysis considers the effect of including or
excluding hydrogen atoms in these molecular representations.
Benchmark results reveal that presence of hydrogen atoms
does not significantly affect our model’s predictions. This
research primarily uses hydrogen-depleted CM descriptors,
which are refined using a norm sorting technique. While the
SOAP model introduces a more complex approach, it only
slightly improves predictive accuracy. Therefore, our approach
in BioTinter-1m prioritizes hydrogen-depleted CM descriptors
for simulating DNA-protein systems.
To illustrate the utility of the Tight-Binding (TB) model, we
investigate the electronic structure variations in complexes
involving Activator Protein 1 (AP-1) and Epstein-Barr Virus Zta
transcription factors with their associated nucleic acids. The
coordination of this sophisticated computational process is
facilitated by the Snakemake workflow management system
[144,145]. Calculations are monitored and streamlined using
custom Python scripts developed for the BioTinter packages,
ensuring an automated and efficient workflow. Subsequent
statistical analysis of the results is performed using R scripts,
providing a comprehensive assessment of the models’
predictive accuracy.
Results and Discussions
TB parameters were calculated for thousands of AB conformers
to analyze the specialization of amino acid or nucleic base
distributions in realistic DNA-protein complexes. A complete
tight binding Hamiltonian can be constructed for any DNAprotein
complex by combining previously reported TB
parameters from AA and BB libraries [92,97]. After collecting
the AA, BB, and AB distributions, there are approximately one
million conformers. This library is useful for describing how
the conformation ensemble influences TB parameters within
distinct protein structures. For instance, the TB parameters
library allows for the extraction of explicit geometric correlation
with the charge transfer couplings. It is commonly observed
that the values of the charge transfer couplings rapidly decay,
decreasing to negligible levels at distances closer than 6.0 Å.
The Principal Component Analysis (PCA) algorithm was used to
categorize various AB parameters and correlate them with their
physical properties. Figure 4 displays a two-dimensional (2D)
plot from PCA that separates the data into distinct clusters. The
color coding represents different amino acid characteristics:
Acidic (red), basic (blue), hydrophobic (purple), and polar
(gray), highlighting the chemical nature of the residues as a
pivotal factor in the variability of tight binding parameters. The
numbers in the brackets on the PC1 and PC2 axes of the PCA
plot represent the percentage of the variance in the dataset
that is explained by each principal component. This plot also
demonstrates the intrinsic distribution of parameters within
each cluster, distinctly influenced by nucleobase type-Adenine
(ADE), Thymine (THY), Guanine (GUA), and Cytosine (CYT).
To ensure functional selection independence, TB parameters
were calculated using the Hartree-Fock (HF) method. For
comparison, TB parameters were also calculated using the
B3LYP level method, as shown in Figure S1. The PCA plots
resulting from the B3LYP calculations confirm the segregation
of data into distinct clusters, as observed with HF calculations.
The spatial arrangement of TB parameters in AB conformers is
primarily determined by the chemical nature and charge state
of the amino acid residues. Secondary factors include the type
of nucleobase and the choice of DFT functional. AB conformers.
The absolute values are used. Histidine is represented in its 3
protonation states: HID, HIE, and HIP. The x-axis label uses color
coding to differentiate amino acids based on their chemical
properties, including hydrophobicity, and polarity, acidity,
basicity, Figure 5 shows a detailed analysis of the average
hopping integrals between each of the 4 nucleobases and 20
standard amino acids. This figure also highlights the varying
interaction strengths of histidine in its 3 protonation states:
HID, HIE, and HIP, which reflect the different coupling strengths
in various biochemical environments. The charge transfer
integrals between nucleobases and various amino acids
exhibit significant differences. Each nucleobase has its own
preferred interacting amino acid with specific charge transfer
couplings. This is fundamental in comprehending the dynamics
of DNA-protein interactions at the electronic and molecular
levels. Aromatic amino acids, such as histidine, phenylalanine,
tryptophan, and tyrosine, generally exhibit significant charge
transfer couplings. This phenomenon may be caused by either
the π-π interaction or the C-H-π interaction, which could
significantly enhance the possibility of electron transfer. The
average on-site energy difference for such AB conformers
is often within 1.0 eV or even lower. Other residues, such as
Serine (SER), Cysteine (CYS), and Methionine (MET), may also
have slightly larger couplings involving the oxygen or sulfur
atom in the side-chain. The on-site energy differences are
approximately 1.0 eV for MET and CYS involving the sulfur atom,
while the SER involving the oxygen atom has an on-site energy
difference as large as 2.0 eV-3.0 eV. The couplings for ILE/ADE
are relatively large for the LUMO orbitals. However, their onsite
energy difference is as large as 4.0 eV. Similar findings are
observed with TB parameters calculated at the B3LYP level
(Figure S2). Averaged over all amino acids, the nucleobases
have the largest charge transfer integrals for THY (0.026 eV)
and ADE (0.023 eV), followed by GUA (0.018 eV) and CYT (0.021
eV). The same trend is observed for the LUMO orbitals, where
the largest charge transfer integrals have a larger value for ADE
(0.054 eV) and THY (0.051 eV), and a smaller value for CYT
(0.050 eV) and GUA (0.033 eV).

Figure 4: The PCA visualization of a spectrum of TB parameters involving HOMO and LUMO orbitals. The visualization includes the 4 types of nucleic bases, which are the components for any possible DNA sequence. The confidence ellipse represents a statistical probability of 95% that encloses a certain percentage of the data points based on their distribution along the principal components

Figure 5: Comparative analysis of the average hopping integrals for HOMO and LUMO across AB conformers. The absolute values are used. Histidine is represented in its three protonation states: HID, HIE, and HIP. The x-axis label uses color coding to differentiate amino acids based on their chemical properties, including hydrophobicity, and polarity, acidity, basicity
Charge transfer couplings are reported to exhibit high sensitivity
to the structural orientation of molecular fragments. Figure
S3 shows several AB structure contacts, where each cluster in
the same AB pairs has significantly different distributions. The
population of charge transfer couplings is “encoded” in various
models of geometric contacts, i.e. the π-π interactions, C-H-π
interactions, the hydrogen bonds or van der Waals contacts.
The orientation of aromatic molecules can either enhance
or diminish charge transfer couplings. The chemical diversity
and specificity of various AB conformers can exhibit subtle
differences in molecular structure or electronic properties,
even within seemingly homogeneous groups. Note that
the charge transfer couplings are not symmetric due to the
inhomogeneity of DNA-protein structures, and the distribution
of one type of amino acid in the frame of another reference
nucleobase residue type is distinct.
As the possible structural changes will influence the electrical
properties of DNA protein complexes, the reasonable
description of transfer couplings beyond the empirical formulas
is very necessary. Figure 6 shows the predictive performance of
the RF model for the TB parameters of arbitrary conformers,
in correlating TB parameters library. The intermolecular
coordinate system uses the distance (r), planar angles (θ, φ),
and dihedral angles (ψ), providing a detailed set of molecular
descriptors that encapsulate the spatial orientation of the
molecules. The Coulomb matrix leverages atomic numbers
(Z) and interatomic distances (R). This approach highlights
how electronic properties are influenced by atomic identities
and their spatial relationships. It emphasizes the importance
of both atomic composition and geometric arrangements
in determining the electronic characteristics of molecules.
These descriptors are essential to machine learning models
for predicting molecular properties. The correlation between
actual and predicted on-site energy is very robust, with the
line of best fit closely aligning with the ideal. The internal
coordinates can only be successful in predicting the onsite
energy, and often difficult to predict the charge transfer
couplings. This suggests that the internal molecular geometries
are also very important.

Figure 6: The predictive performance of the machine learning algorithm is evaluated based on 2 types of molecular descriptors, (a) intermolecular coordinates and (b) hydrogen-depleted Coulomb matrices. The color-coded data points represent different nucleobases
We trained the model using the 8:2 training/test ratio. Then,
one could achieve a unification of accuracy and efficiency to
construct TB Hamiltonian for realistic DNA, protein or DNAprotein
complexes. To facilitate the use of experimental
DNA and protein structures, we also compare the molecular
descriptors with and without hydrogen atoms, and the results
are shown in the table. The possibility of prediction errors in
certain scenarios could lead to outliers, we have established
criteria for identifying similarity between descriptors. These
criteria include an average distance of less than 0.1 Å between
2 descriptors treated as vectors, and an angle of less than 30°
between multidimensional vectors exceeding 3 dimensions.
This involves ensuring that the average distance between any 2
descriptors, viewed as vectors, is less than 0.1 Å, and the angle
between any vectors is less than 30°.
Before examining realistic systems, we first conducted an
evaluation of the performance of our TB parameters. Figure
S4 compares the HOMO/LUMO gap for randomly generated
1000 of dimer and trimer conformers involving nucleobases or
amino acids. The results indicate that our prediction algorithm
achieves deviations of 0.1 eV~0.2 eV, which is quite successful
for such simplified TB model. The randomly generated dimers
and trimers for AA configurations were derived from existing
PDB databases, BB structures were partly derived from PDB
and partly generated by x3DNA, while mixed AB structures
were mainly derived from dimer and trimer structures at
transcription factor binding sites. The insights gained from these
benchmarks can be used to optimize computational strategies
for modeling biological systems. In addition, the HOMO/LUMO
gaps for nucleobases typically reflect their electronic properties
and can vary depending on the computational method used for
calculations [146-152]. Because the calculated HOMO/LUMO gap at HF level is very large (9 eV~10 eV) than experimental
values, while B3LYP provide reasonable results (4.0 eV~5.0
eV). The TB parameters derived from B3LYP calculations would
be used for realistic DNA-protein complexes in the following
discussions.
The applicability of the BioTinter-1m model was evaluated by
studying transcription factors, which are key proteins in the
regulation of gene expression. They modulate the activation
and repression of specific genes by binding to adjacent DNA
sequences. Each transcription factor recognizes and binds
to a specific sequence in the DNA alphabet (A, C, G, and T)
known as a consensus site. Jun protein is an AP-1 protein,
that recognizes 2 versions of a 7-base pair response element,
either TRE (5΄-TGAGTCA-3΄) with PDB ID: 2H7H or meTRE
(5΄-MGAGTCA-3΄) where M=5-methylcytosine, with PDB ID:
5T01. These elements differ only at the first base pair (bp):
With T:A in TRE and 5mC:G (M:G) in meTRE. c-Jun can form
both homodimers and heterodimers. Epstein-Barr Virus (EBV)
Zta is a key transcription factor of the viral lytic cycle that is
homologous to AP-1. The EBV viral genome is unmethylated,
but becomes highly methylated during the latent stage of
the viral cycle [153,154]. Figure 7a illustrates the amino acid
sequences of the human Jun protein, the Epstein-Barr virus
Zta protein, and a mutant variant of the Zta protein (S186A),
referred to as Zta* in this study. Zta* is designed to mimic
the AP-1 protein in its interaction with the TRE DNA element,
with the comparison based on the crystal structure identified
by PDB ID: 2C9L. Both human AP-1 and EBV Zta are bZIP
family transcription factors that bind the classical TRE. They
also recognize methylated cytosine residues within different
sequence contexts [155,156]. The extensive TB parameters
library is large enough to represent most possible AA, BB and
AB conformers found in realistic DNA and protein structures,
with prediction failures under 5% across different systems.
The introduction of the BioTinter-10m model, encompassing
10 million conformers, is anticipated to drastically reduce
prediction errors to less than 0.1%. This process utilizes both
the extensive TB parameters library and a minimal set of onthe-
fly ab initio calculations, ensuring the robustness and
accuracy of our predictions.

Figure 7: Comparative analysis of the protein-DNA interaction complexes, (a) Sequence alignment of the protein Jun, Zta and Zta* with highlighted differences, (b) Sequence alignment of the DNA elements TRE, meTRE. Visualization of, (c) Jun/Jun binding to TRE, (d) Jun/Jun binding to meTRE, and (e) Zta*/Zta* binding to TRE, with the DNA-protein interface marked by a red circle, and corresponding charge transfer networks analysis for HOMO and LUMO orbitals. The size of a network node is related to its degree within the network
The Figure 6 presents a comprehensive view of the interaction
between transcription factors and DNA. Each three-dimensional
structure is accompanied by a schematic diagram of DNAprotein
interface, highlighting the interactions between amino
acids and nucleotides, and is complemented by a graphical
representation of the charge transfer network. The electronic
Hamiltonian of biological molecules diverges from the simple
tridiagonal matrix characteristic of linear molecules due to the
complex stacking arrangements of nucleobases and amino acids
found in actual DNA-protein structures. In prior research, the
concept of a knowledge graph was introduced as a visualization
tool for TB Hamiltonian for biomolecules. In order to construct
the DNA-protein charge transfer network, each residue is
represented by a vertex in the graph, and the edge represents
the strength of charge transfer coupling among residues. To
keep similar geometric feature as the TF molecules, we use
the Kamada-Kawai layout to generate the complex network.
The Kamada-Kawai algorithm is a force-directed graph layout
algorithm that emphasizes the consistency between the
geometric distances and graph-theoretic distances between
nodes [157]. The threshold of significant charge transfer
coupling is set to be 0.001 eV in this work.
Methylation can cause significant changes in DNA-protein
interactions, which may result in notable alterations in gene
expression patterns. Variations in nucleic acid sequences can
have a significant impact on the distribution of TB Hamiltonian
matrix elements at the nucleic acid-protein interface. This
is demonstrated in the binding of the Jun/Jun protein to
TRE and meTRE sequences, as shown in Figures 7c and 7d.
Similarly, alterations in protein sequences impact both the
protein termini and the nucleic acid-protein interface. This is
exemplified in the interactions of Jun and the Zta* mutant
protein with the TRE sequence in Figure 7c and 7e. Charge
transfer networks in these DNA-protein complexes, illustrating
the intricate pathways of electronic interactions within the
binding interface.
After constructing the TB Hamiltonian matrix using the
BioTinter-1m model for a DNA-protein complex, the direct
diagonalization technique is applied to calculate various
electronic structure properties. Currently, the HOMO and
LUMO orbitals for each site are used as the basis functions, of
course additional frontier orbitals could be easily included in
our model as basis functions. As shown in Figure 8, the HOMO/
LUMO gap in water solvent is larger than that in vacuum.
This is quite similar as the results for model systems with
DFT calculations. The frontier orbitals, especially the HOMO
and LUMO orbitals are highlighted with complex network
methodologies (Figure 8). The network displays the molecular
orbital with larger node size for each residue that has large
coefficients. The location of frontier orbitals is generally limited
to a few amino acids and nucleobases. The distance between nodes is related to their sequence distance. Adjacent nodes
on the network, indicate they are relatively close in secondary
sequence structures.

Figure 8: Comparative visualization of molecular orbitals across energy levels and the corresponding HOMO/LUMO distributions with complex network representation for different transcription factor-DNA complexes in (a) vacuum and (b) implicit water solvent. The coloring scheme is the same as figure 7
Despite its simplifications, the complex network analysis
demonstrates an exceptional ability to place electronic
structure variants on equal footing. The distribution of the
HOMO and LUMO orbitals is generally much more dispersed
in the implicit solvent model than in the vacuum model. The
frontier orbitals have very distinct feature for each kind of DNAprotein
complex. It is interesting to note that this structurally
important residue identified as a hub is observed at the DNAprotein
interface or the boundary residues of the DNA chain. In
the computational model, the number of residues in the DNA
chain generally does not exceed 20 residues, which may lead
to boundary residues contributing to the frontier molecular
orbitals. For the Jun/Jun: meTRE complex, the HOMO/LUMO
orbitals are primarily distributed across amino acids and
nucleobases that are relatively distant from each other. This
distribution could indicate that the electronic structure of
the complex facilitates charge transfer over long distances, a
phenomenon that is crucial for many biological processes, such
as signal transduction and energy transfer. This is consistent
with the report that Methylation may cause significant changes
to the photo-stability of nucleic acids, resulting in these sites
becoming mutational hotspots for diseases such as skin cancer.
This analysis is helpful to unravel the richness of biological
electronic structure variants in realistic DNA binding protein
complexes, which would evolve with fluctuating biomolecules
structures.
Figure 9 presents a comparative analysis of the electronic
structures of DNA-protein complexes. The analysis is presented
through their Density of States (DOS) under vacuum and
aqueous conditions. The electronic properties are significantly
influenced by solvent effects, which shift and broaden energy
states around the HOMO and LUMO levels, as detailed
in Figure 8. This demonstrates the role of the solvent in
stabilizing electronic states. The peaks in the DOS become
more pronounced and concentrated, and there are alterations
in peak positions and substantial changes in peak intensities.
These changes underscore the critical impact of the solvent
on the electronic properties at the DNA-protein interface,
where HOMO and LUMO are predominantly associated with
interfacial residues. The Mulliken charges for each residue
were calculated. Figure S5 displays scatter plots of the Mulliken
charge populations for DNA/protein complexes in both vacuum
and aqueous environments. A consistent pattern emerges
across the complexes Jun/Jun: TRE, Jun/Jun: meTRE, and Zta*/
Zta*: TRE, where the distribution of charges on amino acids
and nucleobases appears relatively stable in water but exhibits
subtle shifts in vacuum.

Figure 9: The Density Of States (DOS) plots for DNA-protein complexes are illustrated, contrasting calculations in vacuum (black line) with those in a water solvent environment (red line), (a) The Jun/Jun homodimer interacting with the TRE response element, (b) The Jun/Jun homodimer with the meTRE response element, (c) The Zta*/Zta* homodimer with the TRE element
Conclusion
Protein-DNA interactions are essential for various cellular
processes such as replication, transcription, recombination,
and DNA repair. Here, a library of Tight-binding (TB) parameters
has been derived for amino acids and nucleobases, containing
millions of conformers. Machine learning methods were used
to predict TB parameters for arbitrary fragments of amino acids
and nucleobases. The electronic structure variants of the AP-1
and Epstein-Barr Virus Zta transcription factors were studied in
relation to their respective transcription factor sequences and
binding DNA sequences. The direct diagonalization scheme
was utilized to obtain the tight-binding molecule orbitals.
Our results, including DOS and frontier molecular orbitals,
demonstrate significant variations in electronic structure as
the protein or DNA sequence changes. This work presents a
cost-effective computational tool for analyzing the electronic
structure of DNA-protein structures. These insights contribute
to exemplify the complex interdependence of structure, sequence, and electronic properties in the regulation of gene
expression.
Acknowledgement
This work is supported by Jinzhou Medical University and
Shandong University. L. Du acknowledges the support of the
National Natural Science Foundation of China (No. 21503249).
The authors also acknowledge the prior contributions of
Prof. Chengbu Liu’s group members to the nucleic acid model
systems.
Supporting Information
The details on the predictive performance of the machine
learning algorithm, the TB parameters library at B3LYP level,
the benchmark results, and the Mulliken charge distribution
for DNA-protein complexes are given in the supporting
information.
Competing Interests Statement
The authors have not disclosed any competing interests.
References
- Cozzolino F, Iacobucci I, Monaco V, Monti M (2021) Protein-DNA/RNA interactions: An overview of investigation methods in the-omics era. J Proteome Res. 20:3018-3030.
[Crossref] [Google Scholar]
- Luscombe NM, Thornton JM (2002) Protein-DNA interactions: Amino acid conservation and the effects of mutations on binding specificity. J Mol Biol. 320:991-1009.
[Crossref] [Google Scholar]
- Luscombe NM, Austin SE, Berman HM, Thornton JM (2000) An overview of the structures of protein-DNA complexes. Genome Biol. 1:1-37.
[Crossref] [Google Scholar]
- Siggers T, Gordan R (2014) Protein-DNA binding: Complexities and multi-protein codes. Nucleic Acids Res. 42:2099-2111.
[Crossref] [Google Scholar]
- Grimley E, Liao C, Ranghini EJ, Nikolovska-Coleska Z, Dressler GR (2017) Inhibition of Pax2 transcription activation with a small molecule that targets the DNA binding domain. ACS Chem Biol 12:724-734.
[Crossref] [Google Scholar]
- Mitchell PJ, Tjian R (1989) Transcriptional regulation in mammalian cells by sequence-specific DNA binding proteins. Science. 245:371-378.
[Crossref] [Google Scholar]
- Nikolov DB, Burley SK (1997) RNA polymerase II transcription initiation: A structural view. Proc Natl Acad Sci. 94:15-22.
[Crossref] [Google Scholar]
- Lee TI, Young RA (2000) Transcription of eukaryotic protein-coding genes. Annu Rev Genet. 34:77-137.
[Crossref] [Google Scholar]
- Vinson C, Myakishev M, Acharya A, Mir AA, Moll JR, et al. (2002) Classification of human B-ZIP proteins based on dimerization properties. Mol Cell Biol. 22:6321-6335.
[Crossref] [Google Scholar]
- Babu MM, Luscombe NM, Aravind L, Gerstein M, Teichmann SA (2004) Structure and evolution of transcriptional regulatory networks. Curr Opin Struct Biol. 14:283-291.
[Crossref] [Google Scholar]
- Lin M, Guo J (2019) New insights into protein-DNA binding specificity from hydrogen bond based comparative study. Nucleic Acids Res. 47:11103-11113.
[Crossref] [Google Scholar]
- Olins AL, Olins DE (1974) Spheroid chromatin units (ν Bodies). Science. 183:330-332.
[Crossref] [Google Scholar]
- Kornberg RD, Thomas JO (1974) Chromatin structure: Oligomers of the histones. Science. 184:865-868.
[Crossref] [Google Scholar]
- Kornberg RD (1974) Chromatin structure: A repeating unit of histones and DNA. Science. 184:868-871.
[Crossref] [Google Scholar]
- Fyodorov DV, Zhou BR, Skoultchi A, Bai Y (2018) Emerging roles of linker histones in regulating chromatin structure and function. Nat Rev Mol Cell Biol. 19:192-206
[Crossref] [Google Scholar]
- Luger K, Rechsteiner TJ, Flaus AJ, Waye MMY, Richmond TJ (1997) Characterization of nucleosome core particles containing histone proteins made in bacteria. J Mol Biol. 272:301-311.
[Crossref] [Google Scholar]
- Schlissel G, Rine J (2019) The nucleosome core particle remembers its position through DNA replication and RNA transcription. Proc Natl Acad Sci. 116:20605-20611.
[Crossref] [Google Scholar]
- Sato S, Takizawa Y, Hoshikawa F, Dacher M, Tanaka H, et al. (2021) Cryo-EM structure of the nucleosome core particle containing Giardia lamblia histones. Nucleic Acids Res. 49:8934-8946.
[Crossref] [Google Scholar]
- Latchman DS (1997) Transcription factors: An overview. Int J Biochem Cell Biol. 29:1305-1312.
[Crossref] [Google Scholar]
- Ptashne M, Gann A (1997) Transcriptional activation by recruitment. Nature. 386:569-577.
[Google Scholar]
- Karin M (1990) Too many transcription factors: Positive and negative interactions. New Biol. 2:126-131.
[Google Scholar]
- Nakabeppu Y, Ryder K, Nathans D (1988) DNA binding activities of three murine Jun proteins: Stimulation. Fos Cell. 55:907-915.
[Crossref] [Google Scholar]
- Rauscher FJ, Voulalas PJ, Franza BR, Curran T (1988) Fos and Jun bind cooperatively to the AP-1 site: Reconstitution in vitro. Genes Dev. 2:1687-1699.
[Crossref] [Google Scholar]
- Kataoka K, Noda M, Nishizawa M (1994) Maf nuclear oncoprotein recognizes sequences related to an AP-1 site and forms heterodimers with both Fos and Jun. Mol Cell Biol. 14:700-712.
[Crossref] [Google Scholar]
- Hess J, Angel P, Schorpp-Kistner M (2004) AP-1 subunits: Quarrel and harmony among siblings. J Cell Sci. 117:5965-5973.
[Crossref] [Google Scholar]
- Hai T, Curran T (1991) Cross-family dimerization of transcription factors Fos/Jun and ATF/CREB alters DNA binding specificity. Proc Natl Acad Sci. 88:3720-3724.
[Crossref] [Google Scholar]
- Karin M, Liu Z, Zandi E (1997) AP-1 function and regulation. Curr Opin Cell Biol. 9:240-246.
[Crossref] [Google Scholar]
- Jakoby M, Weisshaar B, Droge-Laser W, Vicente-Carbajosa J, Tiedemann J, et al. (2002) bZIP transcription factors in Arabidopsis. Trends Plant Sci. 7:106-111.
[Crossref] [Google Scholar]
- Eferl R, Wagner EF (2003) AP-1: A double-edged sword in tumorigenesis. Nat Rev Cancer. 3:859-868.
[Crossref] [Google Scholar]
- Liao Y, Zou HF, Wang HW, Zhang WK, Ma B, et al. (2008) Soybean GmMYB76, GmMYB92, and GmMYB177 genes confer stress tolerance in transgenic Arabidopsis plants. Cell Res. 18:1047-1060.
[Crossref] [Google Scholar]
- Uluckan O, Guinea-Viniegra J, Jimenez M, Wagner EF (2015) Signalling in inflammatory skin disease by AP-1 (Fos/Jun). Clin Exp Rheumatol.
[Google Scholar]
- Papoudou-Bai A, Hatzimichael E, Barbouti A, Kanavaros P (2017) Expression patterns of the activator protein-1 (AP-1) family members in lymphoid neoplasms. Clin Exp Med. 17:291-304.
[Crossref] [Google Scholar]
- Martinez-Zamudio RI, Roux PF, de Freitas JANLF, Robinson L, Dore G, et al. (2020) AP-1 imprints a reversible transcriptional programme of senescent cells. Nat Cell Biol. 22:842-855.
[Crossref] [Google Scholar]
- Wu Z, Nicoll M, Ingham RJ (2021) AP-1 family transcription factors: A diverse family of proteins that regulate varied cellular activities in classical hodgkin lymphoma and ALK+ALCL. Exp Hematol Oncol. 10:4.
[Crossref] [Google Scholar]
- Schreiber M, Kolbus A, Piu F, Szabowski A, Mohle-Steinlein U, et al. (1999) Control of cell cycle progression by c-Jun is p53 dependent. Genes Dev. 13:607-619.
[Crossref] [Google Scholar]
- Shaulian E (2010) AP-1-The Jun proteins: Oncogenes or tumor suppressors in disguise? Cell Signal. 22:894-899.
[Crossref] [Google Scholar]
- Sengupta S, Ghufran SM, Khan A, Biswas S, Roychoudhury S (2022) Transition of amyloid/mutant p53 from tumor suppressor to an oncogene and therapeutic approaches to ameliorate metastasis and cancer stemness. Cancer Cell Int. 22:416.
[Crossref] [Google Scholar]
- Bahar ME, Kim HJ, Kim DR (2023) Targeting the RAS/RAF/MAPK pathway for cancer therapy: From mechanism to clinical studies. Signal Transduct Target Ther. 8:455.
[Crossref] [Google Scholar]
- Mondol T, Batabyal S, Pal SK (2012) Ultrafast electron transfer in the recognition of different DNA sequences by a DNA-binding protein with different dynamical conformations. J Biomol Struct Dyn. 30:362-370.
[Crossref] [Google Scholar]
- Batabyal S, Choudhury S, Sao D, Mondol T, Pal SK (2014) Dynamical perspective of protein-DNA interaction. Biomol Concepts. 5:21-43.
[Crossref] [Google Scholar]
- Choudhury S, Naiya G, Singh P, Lemmens P, Roy S, et al. (2016) Modulation of ultrafast conformational dynamics in allosteric interaction of gal repressor protein with different operator DNA sequences. ChemBioChem. 17:605-613.
[Crossref] [Google Scholar]
- Choudhury S, Naiya G, Singh P, Lemmens P, Roy S, et al. (2016) Inside cover: Modulation of ultrafast conformational dynamics in allosteric interaction of gal repressor protein with different operator DNA sequences. ChemBioChem. 17:524-524.
[Crossref] [Google Scholar]
- Choudhury S, Ghosh B, Singh P, Ghosh R, Roy S, et al. (2016) Ultrafast differential flexibility of Cro-protein binding domains of two operator DNAs with different sequences. Phys Chem. 18:17983-17990.
[Crossref] [Google Scholar]
- Cellini A, Shankar MK, Nimmrich A, Hunt LA, Monrroy L, et al. (2024) Directed ultrafast conformational changes accompany electron transfer in a photolyase as resolved by serial crystallography. Nat Chem. 101038-0149.
[Crossref] [Google Scholar]
- Hall DB, Holmlin RE, Barton JK (1996) Oxidative DNA damage through long-range electron transfer. Nature. 382:731-735.
[Crossref] [Google Scholar]
- Carell T, Burgdorf LT, Kundu LM, Cichon M (2001) The mechanism of action of DNA photolyases. Curr Opin Chem Biol. 5:491-498.
[Crossref] [Google Scholar]
- Rogozin IB, Pavlov YI (2003) Theoretical analysis of mutation hotspots and their DNA sequence context specificity. Mutat Res. 544:65-85.
[Crossref] [Google Scholar]
- Delaney S, Barton JK (2003) Long-Range DNA Charge Transport. J Org Chem. 68:6475-6483.
[Google Scholar]
- Tashiro R, Wang AH-J, Sugiyama H (2006) Photoreactivation of DNA by an archaeal nucleoprotein Sso7d. Proc Natl Acad Sci. 103:16655-16659.
[Crossref] [Google Scholar]
- Hatcher E, Balaeff A, Keinan S, Venkatramani R, Beratan DN (2008) PNA versus DNA: Effects of structural fluctuations on electronic structure and hole-transport mechanisms. J Am Chem Soc. 130:11752-11761.
[Crossref] [Google Scholar]
- Boal AK, Genereux JC, Sontz PA, Gralnick JA, Newman DK (2009) Redox signaling between DNA repair proteins for efficient lesion detection. Proc Natl Acad Sci. 106:15237-15242.
[Crossref] [Google Scholar]
- Morinaga H, Takenaka T, Hashiya F, Kizaki S, Hashiya K (2013) Sequence-specific electron injection into DNA from an intermolecular electron donor. Nucleic Acids Res. 41:4724-4728.
[Crossref] [Google Scholar]
- Beratan DN (2019) Why are DNA and protein electron transfer so different? Annu Rev Phys Chem. 70:71-97.
[Crossref] [Google Scholar]
- Hashiya F, Ito S, Sugiyama H (2019) Electron injection from mitochondrial transcription factor A to DNA associated with thymine dimer photo repair. Bioorg Med Chem. 27:278-284.
[Crossref] [Google Scholar]
- Ladik J, Bende A, Bogar F (2010) Charge transfer between DNA and proteins in the nucleosomes. Theor Chem Acc. 125:185-191.
[Google Scholar]
- Sontz PA, Mui TP, Fuss JO, Tainer JA, Barton JK (2012) DNA charge transport as a first step in coordinating the detection of lesions by repair proteins. Proc Natl Acad Sci. 109:1856-1861.
[Crossref] [Google Scholar]
- Grodick MA, Muren NB, Barton JK (2015) DNA charge transport within the cell. Biochemistry. 54:962-973.
[Crossref] [Google Scholar]
- Arnold AR, Grodick MA, Barton JK (2016) DNA charge transport: From chemical principles to the cell. Cell Chem Biol. 23:183-197.
[Crossref] [Google Scholar]
- Fuss JO, Tsai CL, Ishida JP, Tainer JA (2015) Emerging critical roles of Fe-S clusters in DNA replication and repair. Biochim Biophys Acta BBA-Mol Cell Res. 1853:1253-1271.
[Crossref] [Google Scholar]
- O'Brien E, Holt ME, Thompson MK, Salay LE, Ehlinger AC, et al. (2017) The [4Fe4S] cluster of human DNA primase functions as a redox switch using DNA charge transport. Science. 355:eaag1789
[Crossref] [Google Scholar]
- Tse ECM, Zwang TJ, Barton JK (2017) The oxidation state of [4Fe4S] clusters modulates the DNA-binding affinity of DNA repair proteins. J Am Chem Soc. 139:12784-12792.
[Crossref] [Google Scholar]
- Syed A, Tainer JA (2019) Charge transport communication through DNA by protein Fe-S clusters: How far is not too far? ACS Cent Sci. 5:7-9.
[Crossref] [Google Scholar]
- Derr JB, Tamayo J, Clark JA, Morales M, Mayther MF, et al. (2020) Multifaceted aspects of charge transfer. Phys Chem. 22:21583-21629.
[Crossref] [Google Scholar]
- Fox SJ, Dziedzic J, Fox T, Tautermann CS, Skylaris CK (2014) Density functional theory calculations on entire proteins for free energies of binding: Application to a model polar binding site. Proteins Struct Funct Bioinforma. 82:3335-3346.
[Crossref] [Google Scholar]
- He X, Zhu T, Wang X, Liu J, Zhang JZH (2014) Fragment quantum mechanical calculation of proteins and its applications. Acc Chem Res. 47:2748-2757.
[Crossref] [Google Scholar]
- Koch T, Shim I, Lindow M, Orum H, Bohr HG (2014) Quantum mechanical studies of DNA and LNA. Nucleic Acid Ther. 24:139-148.
[Crossref] [Google Scholar]
- Deng A, Li H, Bo M, Huang Z, Li L, et al. (2020) Understanding atomic bonding and electronic distributions of a DNA molecule using DFT calculation and BOLS-BC model. Biochem Biophys Rep. 24:100804.
[Crossref] [Google Scholar]
- Gundelach L, Fox TS, Tautermann C, Skylaris CK (2021) Protein-ligand free energies of binding from full-protein DFT calculations: Convergence and choice of exchange-correlation functional. Phys Chem. 23:9381-9393.
[Crossref] [Google Scholar]
- Slater JC, Koster GF (1954) Simplified LCAO method for the periodic potential problem. Phys Rev. 94:1498-1524.
[Crossref] [Google Scholar]
- Goringe CM, Bowler DR, HernÃÃÂ??¡ndez E (1997) Tight-binding modelling of materials. Rep Prog Phys. 60:1447.
[Google Scholar]
- Conwell EM, Rakhmanova SV (2000) Polarons in DNA. Proc Natl Acad Sci. 97:4556-4560.
[Crossref] [Google Scholar]
- Grimme S, Bannwarth C, Shushkov P (2017) A robust and accurate tight-binding quantum chemical method for structures, vibrational frequencies, and noncovalent interactions of large molecular systems parametrized for all spd-block elements (Z=1-86). J Chem Theory Comput. 13:1989-2009.
[Crossref] [Google Scholar]
- Spiegelman F, Tarrat N, Cuny J, Dontot L, Posenitskiy E, et al. (2020) Density-functional tight-binding: Basic concepts and applications to molecules and clusters. Adv Phys X. 5:1710252.
[Crossref] [Google Scholar]
- Vishal, Janik MJ, Milner ST (2024) Tight-binding model describes frontier orbitals of non-fullerene acceptors. Mol Syst Des Eng. 9:382-398.
[Crossref] [Google Scholar]
- Koslowski T (1999) Localized and extended electronic eigenstates in proteins: A tight-binding approach. J Chem Phys. 110:12233-12239.
[Crossref] [Google Scholar]
- Song J, Zhang DC, Liu DS, Mei LM, Xie SJ (2005) Density of states of DNA molecules with varied itinerant electrons. Synth Met. 155:607-610.
[Crossref] [Google Scholar]
- Triberis GP, Dimakogianni M (2008) Correlated small polaron hopping transport in 1D disordered systems at high temperatures: A possible charge transport mechanism in DNA. J Phys Condens Matter. 21:035114.
[Crossref] [Google Scholar]
- Yamada H, Iguchi K (2010) Some effective tight-binding models for electrons in DNA conduction: A review. Adv Condens Matter Phys. 2010:380710.
[Crossref] [Google Scholar]
- Zilly M, Ujsaghy O, Wolf DE (2010) Conductance of DNA molecules: Effects of decoherence and bonding. Phys Rev B. 82:125125.
[Crossref] [Google Scholar]
- Malakooti S, Hedin E, Joe Y (2013) Tight-binding approach to strain-dependent DNA electronics. J Appl Phys. 114:014701.
[Crossref] [Google Scholar]
- Hu F, He F, Yaron DJ (2023) Treating semiempirical hamiltonians as flexible machine learning models yields accurate and interpretable results. J Chem Theory Comput. 19:6185-6196.
[Crossref] [Google Scholar]
- Gillet N, Berstis L, Wu X, Gajdos F, Heck A, et al. (2016) Electronic coupling calculations for bridge-mediated charge transfer using Constrained Density Functional Theory (CDFT) and effective hamiltonian approaches at the Density Functional Theory (DFT) and Fragment-Orbital Density Functional Tight Binding (FODFTB) Level. J Chem Theory Comput. 12:4793-4805.
[Crossref] [Google Scholar]
- Beratan DN, Onuchic JN, Hopfield JJ (1987) Electron tunneling through covalent and noncovalent pathways in proteins. J Chem Phys. 86:4488-4498.
[Crossref] [Google Scholar]
- Grozema FC, Berlin YA, Siebbeles LDA (2000) Mechanism of charge migration through DNA: Molecular wire behavior, single-step tunneling or hopping? J Am Chem Soc. 122:10903-10909.
[Crossref] [Google Scholar]
- Balabin IA, Onuchic JN (2000) Dynamically controlled protein tunneling paths in photosynthetic Reaction Centers. Science. 290:114-117.
[Crossref] [Google Scholar]
- de la Lande A, Salahub DR (2010) Derivation of interpretative models for long range electron transfer from constrained density functional theory. J Mol Struct THEOCHEM. 943:115-120.
[Crossref] [Google Scholar]
- de la Lande A, Babcock NS, Rezac J, Sanders BC, Salahub DR (2010) Surface residues dynamically organize water bridges to enhance electron transfer between proteins. Proc Natl Acad Sci. 107:11799-11804.
[Crossref] [Google Scholar]
- Balabin IA, Hu X, Beratan DN (2012) Exploring biological electron transfer pathway dynamics with the Pathways Plugin for VMD. J Comput Chem. 33:906-910.
[Crossref] [Google Scholar]
- Hammi EE, Houee-Levin C, Rezac J, Levy B, Demachy I, et al. (2012) New insights into the mechanism of electron transfer within flavohemoglobins: Tunnelling pathways, packing density, thermodynamic and kinetic analyses. Phys Chem. 14:13872-13880.
[Crossref] [Google Scholar]
- Mcmahan AK, Klepeis JE (1997) Ab initio calculation of tight-binding parameters. MRS Proc. 491:199.
[Google Scholar]
- Agapito LA, Ismail-Beigi S, Curtarolo S, Fornari M, Nardelli MB (2016) Accurate tight-binding Hamiltonian matrices from ab initio calculations: Minimal basis sets. Phys Rev B. 93:035104.
[Crossref] [Google Scholar]
- Wang H, Liu F, Dong T, Du L, Zhang D (2018) Charge-transfer knowledge graph among amino acids derived from high-throughput electronic structure calculations for protein database. ACS Omega. 3:4094-4104.
[Crossref] [Google Scholar]
- Berman HM, Westbrook J, Feng Z, Gilliland G, Bhat TN, et al. (2000) The protein data bank. Nucleic Acids Res. 28:235-242.
[Crossref] [Google Scholar]
- Lu X, Olson WK (2003) 3DNA: A software package for the analysis, rebuilding and visualization of three-dimensional nucleic acid structures. Nucleic Acids Res. 31:5108-5121.
[Crossref] [Google Scholar]
- Norambuena T, Melo F (2010) The protein-DNA interface database. BMC Bioinformatics. 11:1-12.
[Google Scholar]
- Baek M, McHugh R, Anishchenko I, Jiang H, Baker D (2024) Accurate prediction of protein-nucleic acid complexes using RoseTTA FoldNA. Nat Methods. 21:117-121.
[Google Scholar]
- Liu F, Du L (2023) The charge transfer network model for arbitrary proteins complexes. Biomed Comput Biol Springer.
- Behler J, Parrinello M (2007) Generalized neural-network representation of high-dimensional potential-energy surfaces. Phys Rev Lett. 98:146401.
[Crossref] [Google Scholar]
- Braams BJ, Bowman JM (2009) Permutationally invariant potential energy surfaces in high dimensionality. Int Rev Phys Chem. 28:577-606.
[Crossref] [Google Scholar]
- Bartok AP, Payne MC, Kondor R, Csanyi G (2010) Gaussian approximation potentials: The accuracy of quantum mechanics, without the electrons. Phys Rev Lett. 104:136403.
- Smith JS, Isayev O, Roitberg AE (2017) ANI-1: An extensible neural network potential with DFT accuracy at force field computational cost. Chem Sci. 8:3192-3203.
[Crossref] [Google Scholar]
- Podryabinkin EV, Shapeev AV (2017) Active learning of linearly parametrized interatomic potentials. Comput Mater Sci. 140:171-180.
[Crossref] [Google Scholar]
- Keith JA, Vassilev-Galindo V, Cheng B, Chmiela S, Gastegger M, et al. (2021) Combining machine learning and computational chemistry for predictive insights into chemical systems. Chem Rev. 121:9816-9872.
[Crossref] [Google Scholar]
- Hagg A, Kirschner KN (2023) Open-source machine learning in computational chemistry. J Chem Inf Model. 63:4505-4532.
[Crossref] [Google Scholar]
- Dral PO (2024) AI in computational chemistry through the lens of a decade-long journey. Chem Commun. 60:3240-3258.
[Crossref] [Google Scholar]
- Back S, Aspuru-Guzik A, Ceriotti M, Gryn'ova G, Grzybowski B, et al. (2024) Accelerated chemical science with AI. Digit Discov. 3:23-33.
[Crossref] [Google Scholar]
- Chmiela S, Sauceda HE, Muller KR, Tkatchenko A (2018) Towards exact molecular dynamics simulations with machine-learned force fields. Nat Commun. 9:3887.
[Crossref] [Google Scholar]
- Chmiela S, Tkatchenko A, Sauceda HE, Poltavsky I, Schutt KT (2017) Machine learning of accurate energy-conserving molecular force fields. Sci Adv. 3:e1603015.
[Crossref] [Google Scholar]
- Ryczko K, Strubbe DA, Tamblyn I (2019) Deep learning and density-functional theory. Phys Rev A. 100:022512.
[Crossref] [Google Scholar]
- Brockherde F, Vogt L, Li L, Tuckerman ME, Burke K, et al. (2017) Bypassing the Kohn-Sham equations with machine learning. Nat Commun. 8:872.
[Crossref] [Google Scholar]
- Guzman-Pando A, Ramirez-Alonso G, Arzate-Quintana C, Camarillo-Cisneros J (2023) Deep learning algorithms applied to computational chemistry. Mol Divers. 101007:10771.
[Crossref] [Google Scholar]
- Wilkins DM, Grisafi A, Yang Y, Lao KU, DiStasio RA (2019) Accurate molecular polarizabilities with coupled cluster theory and machine learning. Proc Natl Acad Sci. 116:3401-3406.
[Crossref] [Google Scholar]
- Gastegger M, Behler J, Marquetand P (2017) Machine learning molecular dynamics for the simulation of infrared spectra. Chem Sci. 8:6924-6935.
[Crossref] [Google Scholar]
- Schutt KT, Gastegger M, Tkatchenko A, Muller KR, Maurer RJ (2019) Unifying machine learning and quantum chemistry with a deep neural network for molecular wave functions. Nat Commun. 10:5024.
[Crossref] [Google Scholar]
- Sugden B (2014) Epstein-barr virus: The path from association to causality for a ubiquitous human pathogen. PLOS Biol. 12:e1001939.
[Crossref] [Google Scholar]
- Chiu YF, Sugden B (2016) Epstein-barr virus: The path from latent to productive infection. Annu Rev Virol. 3:359-372.
[Crossref] [Google Scholar]
- Cui P, Wu J, Zhang G, Liu C (2008) Hole polarons in poly (G)-poly (C) and poly (A)-poly (T) DNA molecules. Sci China Ser B Chem. 51:1182-1186.
[Google Scholar]
- Luscombe NM, Laskowski RA, Thornton JM (2001) Amino acid-base interactions: A three-dimensional analysis of protein-DNA interactions at an atomic level. Nucleic Acids Res. 29:2860-2874.
[Crossref] [Google Scholar]
- Case DA, Aktulga HM, Belfon K, Cerutti DS, Cisneros GA, et al (2023) Amber tools. J Chem Inf Model. 63:6183-6191.
[Google Scholar]
- Zheng B, Wu J, Sun W, Liu C (2006) Trapping and hopping of polaron in DNA periodic stack. Chem Phys Lett. 425:123-127.
[Crossref] [Google Scholar]
- Canola S, Pecoraro C, Negri F (2016) Dimer and cluster approach for the evaluation of electronic couplings governing charge transport: Application to two pentacene polymorphs. Chem Phys. 478:130-138.
[Crossref] [Google Scholar]
- Valeev EF, Coropceanu V, da Silva Filho DA, Salman S, BrÃÃÂ??©das JL (2006) Effect of electronic polarization on charge-transport parameters in molecular organic semiconductors. J Am Chem Soc. 128:9882-9886.
[Crossref] [Google Scholar]
- Cui P, Zhang D, Liu Y, Yuan S, Li B, et al. (2011) Tight-binding model method and its applications in DNA molecules. Sci Sin Chim. 41:748-755.
[Google Scholar]
- Kensert A, Alvarsson J, Norinder U, Spjuth O (2018) Evaluating parameters for ligand-based modeling with random forest on sparse data sets. J Cheminformatics. 10:49.
[Crossref] [Google Scholar]
- Breskvar M, Kocev D, DÃÃÂ??¾eroski S (2018) Ensembles for multi-target regression with random output selections. Mach Learn. 107:1673-1709.
[Google Scholar]
- Haghighatlari M, Li J, Heidar-Zadeh F, Liu Y, Guan X (2020) Learning to make chemical predictions: The interplay of feature representation, data, and machine learning methods. Chem. 6:1527-1542.
[Crossref] [Google Scholar]
- Sun L, Ji Y, Zhu X, Peng T (2022) Process knowledge-based random forest regression for model predictive control on a nonlinear production process with multiple working conditions. Adv Eng Inform. 52:101561.
[Crossref] [Google Scholar]
- Schmid L, Gerharz A, Groll A, Pauly M (2023) Tree-based ensembles for multi-output regression: Comparing multivariate approaches with separate univariate ones. Comput Stat Data Anal. 179:107628.
[Crossref] [Google Scholar]
- Mahesh RNU, Nelleri A (2023) Multi-class classification and multi-output regression of three-dimensional objects using artificial intelligence applied to digital holographic information. Sensors. 23:1095.
[Crossref] [Google Scholar]
- Pedregosa F, Varoquaux G, Gramfort A, Michel V, Thirion B, et al. (2011) Scikit-learn: Machine learning in python. J Mach Learn Res. 12:2825-2830.
[Google Scholar]
- Mitchell JBO (2014) Machine learning methods in chemoinformatics WIREs. Comput Mol Sci. 4:468-481.
[Crossref] [Google Scholar]
- Goh GB, Hodas NO, Vishnu A (2017) Deep learning for computational chemistry. J Comput Chem. 38:1291-1307.
[Crossref] [Google Scholar]
- Korshunova M, Ginsburg B, Tropsha A, Isayev O (2021) OpenChem: A deep learning toolkit for computational chemistry and drug design. J Chem Inf Model. 61:7-13.
[Crossref] [Google Scholar]
- Jeyachitra RK, Manochandar S (2023) Machine learning and deep learning in multimodal biometric and machine learning technologies. John Wiley Sons. 173-225.
- James T, Hristozov D (2022) Deep learning and computational chemistry in artificial intelligence in drug design humana. New York. 125-151.
- Paszke A, Gross S, Massa F, Lerer A, Bradbury J, et al. (2019) PyTorch: An imperative style, high-performance deep learning library. Adv Neural Information Process Sys.
- Neese F, Wennmohs F, Becker U, Riplinger C (2020) The ORCA quantum chemistry program package. J Chem Phys. 152:224108.
[Crossref] [Google Scholar]
- Frisch MJ, Trucks GW, Cheeseman JR, Scalmani G, Caricato M, et al. (2009) Gaussian 09.
[Google Scholar]
- Jumper J, Evans R, Pritzel A, Green T, Figurnov M, et al. (2021) Highly accurate protein structure prediction with AlphaFold. Nature. 596:583-589.
[Crossref] [Google Scholar]
- Jager MOJ, Morooka EV, Federici Canova F, Himanen L, et al. (2018) Machine learning hydrogen adsorption on nanoclusters through structural descriptors. Npj Comput Mater. 4:37.
[Google Scholar]
- Rupp M, Tkatchenko A, Muller KR, von Lilienfeld OA (2012) Fast and accurate modeling of molecular atomization energies with machine learning. Phys Rev Lett. 108:058301.
[Crossref] [Google Scholar]
- De S, Bartok AP, Csanyi G, Ceriotti M (2016) Comparing molecules and solids across structural and alchemical space. Phys Chem. 18:13754-13769.
[Crossref] [Google Scholar]
- Willatt MJ, Musil F, Ceriotti M (2018) Feature optimization for atomistic machine learning yields a data-driven construction of the periodic table of the elements. Phys Chem. 20:29661-29668.
[Crossref] [Google Scholar]
- Molder F, Jablonski KP, Letcher B, Hall MB, Tomkins-Tinch CH, et al. (2021) Sustainable data analysis with Snakemake. F1000Research. 10:33.
[Crossref] [Google Scholar]
- Liu F, Du L (2024) Decoding dominant interaction patterns in halogenated dimers: A journey from halogen bonding to Van der Waals interactions. Comput Theor Chem. 1233:114513.
[Crossref] [Google Scholar]
- Clark LB, Peschel GG, Tinoco IJ (1965) Vapor spectra and heats of vaporization of some purine and pyrimidine bases. J Phys Chem. 69:3615-3618.
[Crossref] [Google Scholar]
- Li Liang, Lubman DM (1987) Ultraviolet-visible absorption spectra of biological molecules in the gas phase using pulsed laser-induced volatilization enhancement in a diode array spectrophotometer. Anal Chem. 59:2538-2541.
[Crossref] [Google Scholar]
- Ladik J, Bende A, Bogar F (2008) The electronic structure of the four nucleotide bases in DNA, of their stacks, and of their homopolynucleotides in the absence and presence of water. J Chem Phys. 128:105101.
[Crossref] [Google Scholar]
- Miyahara T, Nakatsuji H (2011) Absorption spectra of nucleic acid bases studied by the Symmetry-Adapted-Cluster Configuration-Interaction (SAC-CI) method. Collect Czechoslov Chem Commun. 76:537-552.
[Crossref] [Google Scholar]
- Foster ME, Wong BM (2012) Nonempirically tuned range-separated DFT accurately predicts both fundamental and excitation gaps in DNA and RNA nucleobases. J Chem Theory Comput. 8:2682-2687.
[Crossref] [Google Scholar]
- Leal LAE, Lopez-Acevedo O (2015) On the interaction between gold and silver metal atoms and DNA/RNA nucleobases-a comprehensive computational study of ground state properties. Nanotechnol Rev. 4:173-191.
[Crossref] [Google Scholar]
- Ungordu A, Tezer N (2017) The solvent (water) and metal effects on HOMO-LUMO gaps of guanine base pair: A computational study. J Mol Graph Model. 74:265-272.
[Crossref] [Google Scholar]
- Kenney SC, Mertz JE (2014) Regulation of the latent-lytic switch in Epstein-barr virus. Semin Cancer Biol. 26:60-68.
[Crossref] [Google Scholar]
- Paulson EJ, Speck SH (1999) Differential methylation of epstein-barr virus latency promoters facilitates viral persistence in healthy seropositive individuals. J Virol. 73:9959-9968.
[Crossref] [Google Scholar]
- Petosa C, Morand P, Baudin F, Moulin M, Artero JB (2006) Structural basis of lytic cycle activation by the epstein-barr virus ZEBRA. Protein Mol Cell. 21:565-572.
[Crossref] [Google Scholar]
- Glover JNM, Harrison SC (1995) Crystal structure of the heterodimeric bZIP transcription factor c-Fos-c-Jun bound to DNA Nature. 373:257-261.
[Crossref] [Google Scholar]
- Schreiber F, Dwyer T, Marriott K, Wybrow M (2009) A generic algorithm for layout of biological networks. BMC Bioinformatics. 10:1-12.
[Crossref] [Google Scholar]
Citation: Du L, Liu C (2024) Elucidating Electronic Structure Variations in Nucleic Acid-protein Complexes Involved in Transcription Regulation Using a Tight-binding Approach. Biochem Mol Biol J. 10:21.
Copyright: © 2024 Du L, et al. This is an open-access article distributed under the terms of the Creative Commons Attribution License, which permits unrestricted use, distribution, and reproduction in any medium, provided the original author and source are credited.