Keywords
Experiential avoidance; Emotion regulation; Emotional avoidance; Thought suppression; Cognitive avoidance
Much research has been devoted to exploring how people avoid thoughts and emotions. In a study of thought suppression, Wegner and colleagues (Wegner, Schneider, Carter, White, 1987) [1] asked groups of undergraduate participants to “think of anything, but try not to think of a white bear” (‘suppression’ condition) or, alternatively, to “think of a white bear” (‘expression’ condition). The researchers found that participants who were instructed initially to suppress the thought reported more instances of intrusive “white-bear” thoughts than participants given the ‘expression’ directive. This “rebound effect” suggested that attempts at thought avoidance may actually increase the intrusiveness of a thought. In a similar study, Gross (1998) [2] showed 120 participants an emotionally confronting (“disgusting”) film and asked them to either suppress their emotional responses, or reappraise their thoughts. Gross found that suppression of emotions led to increases in indices of sympathetic nervous system activation. The interest of phenomena such as these in the therapy context is that intrusive thoughts and the difficulty of controlling or suppressing uncomfortable and distressing thoughts and emotions is a feature of many psychopathological presentations.
Avoidance behaviours have been a focus of research (Leventhal, 2008) [3], particularly in its relation to psychopathology (Simpson, Jakupcak, Luterek, 2006) [4]. The more recently used term ‘Experiential Avoidance’ (EA) refers to a person’s attempts or desires to avoid and suppress unwanted internal experiences, such as emotions, thoughts, body sensations, memories or urges (Hayes, Wilson, Gifford, Follette, Strosahl, 1996) [5]. It has been suggested that EA plays a role in the onset and/or maintenance of a variety of maladaptive behaviours and psychopathologies (Hayes et al., 1996; Hayes, Strosahl, Wilson, 1999) [5, 6] such as anxiety (Roemer, Salters, Raffa, Orsillo, 2005) [7]; GAD (Roemer, et al., 2005) [7]; panic (Borkovec & Roemer, 1995) [8]; PTSD (Orcutt, Pickett, Pope, 2005) [9]; depression (Lynch, Robins, Morse, Krause, 2001); self-harm (Chapman, Gratz, Brown, 2006) [11]; substance misuse (Cooper, Russell, Skinner, Frone, Mudar, 1992) [12]; and borderline personality BPD) (Chapman, Specht, Cellucci, 2005) [13]. Moreover, EA may be a significant impediment to effective engagement in therapy (Rüsch, Schiel, Corrigan, Leihener, Jacob, Olschewski, et al., 2008) [14]; to the emotional “processing” of experiences (Greenberg & Pascual-Leone, 2006) [15]; and to the behaviour changes essential to invalidating dysfunctional thoughts and attitudes (Beck, 1995) [16].
Measurement of EA is complicated because it encompasses such a wide variety of behaviours (Shahar & Herr, 2011) [17]. Moreover, it raises conceptual difficulties because it appears to conflate separable processes – for example, the differences between cognitive and affective avoidance. The psychometric scale most widely used to measure EA is the Action and Avoidance Questionnaire (AAQ-II) (Bond, Hayes, Baer, Carpenter, Guenole, Orcutt, et al., 2009) [18], a scale that has been shown to be sensitive to the assessment of avoidance in people with mild to moderate depression and anxiety (Fledderus, Voshaar, Klooster, Bohlmeijer, 2012) [19]. The AAQ-II has been interpreted as indicating that EA is a unidimensional construct (Fledderus, et al., 2012; Bond, Hayes, Baer, Carpenter, Guenole, Orcutt, et al., 2011; McCracken & Zhao-O’Brien, 2010) [19, 20, 21]. Nevertheless, a recent empirical review (Chawla & Ostafin, 2007) [22] has suggested that EA may be either an overarching construct that incorporates a variety of other strategies (such as thought control and emotional control/suppression), or a multidimensional construct with a number of different dimensions (e.g., cognitive, emotional, and behavioural). Some researchers have suggested that different domains of avoidance (e.g. cognitive and affective) can be distinguished and should be separately identified since they relate differentially to various psychopathologies (Blalock & Joiner, 2000; Ottenbreit & Dobson, 2004; Gamez, Chmielewski, Kotov, Ruggero, Watson, 2011). [23, 24, 25]
In the current study the responses of volunteer clients from community mental health services on the AAQ-II are compared with scores on scales of specific aspects of EA, namely, thought control (measured by the White Bear Suppression Inventory - WBSI; Wegner & Zanakos, 1994) [26], and emotion control (measured by the Difficulties in Emotion Regulation Scale – DERS; Gratz & Roemer, 2004) [27] in order to evaluate the dimensionality of the AAQ-II. In addition, the measures were taken both at initial baseline assessment and after 12 weeks of therapy in order to evaluate the sensitivity to change of the assessment scales. It is hypothesised that changes in EA as measured by the AAQ-II over a 12-week period of therapy will not be explained exclusively by one or other of the WBSI and DERS changes but will be explained by combined scores on the WBSI and the DERS scores across a range of psychopathologies.
Method
Participants
The participant sample comprised clients accepted into mental health services of the Hunter New England Health Service, New South Wales, Australia. The services were the Newcastle Mental Health Service; the Newcastle Supported Recovery Service; the Lake Macquarie Mental Health Service and the Lake Macquarie Supported Recovery Service. These services provide medium medium term on-going therapy to non-acute clients. All participants met DSM-IV-TR (American Psychiatric Association, 2000) [28] criteria for a variety of conditions (Table 1). Clients who were considered unable to give informed consent or who presented with psychotic features or a diagnosis of Schizophrenia or Psychotic Disorder were excluded.
| Key characteristics of the sample (N = 82) |
| Mean age (years) (SD) |
38.41 (12.927) |
| Range of age (years) |
19 - 70 |
| Characteristics |
N |
| Gender |
|
| Male |
20 |
| Female |
62 |
| Diagnoses |
|
| Borderline Personality Disorder |
30 |
| Posttraumatic Stress Disorder |
14 |
| Major Depressive Disorder |
11 |
| Obsessive Compulsive Disorder |
8 |
| Bipolar Affective Disorder |
7 |
| Generalized Anxiety Disorder |
3 |
| Dissociative Disorder, Not Otherwise Specified |
2 |
| Panic Disorder with Agoraphobia |
1 |
| Conversion Disorder |
1 |
| Obsessive Compulsive Personality Disorder |
1 |
| Anorexia Nervosa |
1 |
| Trichotillomania |
1 |
| Panic Disorder |
1 |
| Specific Phobia |
1 |
| Engage in Deliberate Self-Harm |
44 |
| Do Not Engage in Deliberate Self-Harm |
38 |
| PRN Medication (“when necessary”) |
28 |
Table 1: Participant demographics .
Of the 104 clients who volunteered, 19 dropped out prior to follow-up assessment and 3 generated unreliable data and were removed from the analysis. The mean age of participants was 38.41 (SD = 12.927), with an age range of 19 to 70 years. Twenty were male (24.4% of the total sample) and 62 female (75.6% of the total sample). All participants were recruited either at the initial stage of individual therapy, or recently commenced individual therapy.
Instruments
Three published questionnaires were used in the study, the Acceptance and Action Questionnaire – II (AAQ-II); the White Bear Suppression Inventory (WBSI) and the Difficulties in Emotion Regulation Scale (DERS); together with a six-item scale devised for this study.
The Acceptance and Action Questionnaire – II (AAQ-II) (Bond, et al., 2009) [18] is a 10-item revision of the original 9-item scale (Hayes, Strosahl, Wilson, Bissett, Pistorello, Toarmino, et al., 2000) [29]. The AAQ-II is a self-report measure of EA. It is designed to measure a person’s ability to remain in contact with painful and negative private events (e.g., “I’m afraid of my feelings”; “My painful memories prevent me from having a fulfilling life”). Items are rated on 7-point Likert scales and summed to produce a total score. Internal consistency (Cronbach is reported to range from = 0.76 to 0.87 in seven samples (n = 3280; Bond et al., 2009) [18]. The AAQ-II shows convergent validity, with significant correlations with the Beck Anxiety Inventory (BAI), the Beck Depression Inventory (BDI-II), and the WBSI (Bond, et al., 2009) [18]. Three confirmatory factor analyses have suggested a onefactor solution, after allowing for a method effect entailing three reversed (positively worded) items (Bond, et al., 2011) [20]. Iverson and colleagues (Iverson, Follette, Pistorello, Fruzzetti, 2012) [30] have indicated good reliability in their sample (α = 0.82).
The WBSI (White Bear Suppression Inventory) (Wegner & Zanakos, 1994) [26] is a 15-item self-report measure designed to assess thought suppression and thought intrusion. The internal consistency (Cronbach α) ranges from α = 0.87 - 0.89. Test-retest reliability is reported as r=0.92 for 1 week and r=0.69 for 3 weeks to 3 months. Significant correlations with the Beck Depression Inventory (BDI) and the State-Trait Anxiety Inventory (STAI) (Wegner & Zanakos, 1994) [26] indicate acceptable convergent validity. The WBSI has been used in clinical research relating to depressive symptoms (Wenzlaff & Luxton, 2003; Van der Does, 2005) [31, 32], PTSD (Amstadter & Vernon, 2008; Tull, Gratz, Salters, & Roemer, 2004) [33, 34], OCD (Rassin, Muris, Schmidt, Merckelbach, 2000) [35], and acute stress (Nixon, Menne, Kling, Steele, Barnes, Dohn, et al., 2008) [36].
The Difficulties in Emotion Regulation Scale (Gratz & Roemer, 2004) [27] is a 36-item, self-report questionnaire designed to assess multiple aspects of emotion dysregulation; namely, nonacceptance of emotional responses (DERS-NA); impulse control difficulties (DERS-I); difficulties engaging in goal directed behaviour (DERS-G); limited access to emotion regulation strategies (DERS-S); lack of emotional awareness (DERS-A); and lack of emotional clarity (DERS-C). Participants are asked to specify how often each item applies to them using a five-point Likert scale. The DERS has good internal consistency (Cronbach α = 0.93); testretest reliability (r= 0.88) and construct validity (Gratz& Roemer, 2004). The DERS is significantly related to measures of emotion regulation, emotional inexpressiveness, experiential avoidance, self-harm and intimate partner abuse (Gratz & Roemer, 2004) [27]. It is a behavioural measure of emotion dysregulation (Gratz, Rosenthal, Tull, Lejuez, Gunderson, 2006) [37]. The DERS has been used in research with clinical populations including those diagnosed with BPD (Gratz & Gunderson, 2006) [38], depression (Ehring, Fischer, Schnuelle, Bosterling & Tuschen-Caffier, 2008) [39], anorexia (Harrison, Sullivan, Tchanturia, Treasure, 2009) [40], panic (Tull & Roemer, 2007) [41], GAD (Salters-Pedneault, Roemer, Tull, Rucker, Mennin, 2006) [42], and PTSD (Tull, Barrett, McMillan, Roemer, 2007; Ehring & Quack, 2010) [43, 44]. The DERS provides an overall total score as well as subscale scores.
The Therapist Rating Scale is a non-validated six-item questionnaire designed for this study. This questionnaire was developed to elicit the therapists’ impressions of their clients use of EA strategies and of any changes in such during the course of therapy. The 6 questions were: (1) The client wishes they could stop thinking of certain things, (2) Sometimes the client really wishes they could stop thinking, (3) The client has thoughts that they try to avoid, (4) The client has no idea how they are feeling, (5) When the client is upset, they have difficulty getting things done, (6) When the client is upset, they have difficulty controlling their behaviours. Therapists rated their impressions on a 5-point Likert scale and items were summed for a total.
Procedure
Approval to proceed was granted by the Hunter Area Health Research Ethics Committee (Approval Number:09/06/17/5.02).
Potential participants were informed of the study in interviews conducted by a treating Psychiatrist or Senior Clinician. After provision of voluntary consent, a semi-structured interview was conducted to clarify diagnosis and assess the client’s appropriateness for the study. Clients deemed eligible were allocated to an appropriate therapy approach according to normal service procedures. Therapy approaches included Cognitive Behaviour Therapy (39 participants), Dialectical Behaviour Therapy or Dialectical Behaviour Informed Therapy (21 participants), Interpersonal Therapy (7 participants), Solution-Focused Brief Therapy (5 participants), Psychoanalysis (5 participants) Supportive Therapy (2 participants), Acceptance and Commitment Therapy (2 participants), and Psychodynamic Therapy (1 participant).
Clients completed the three questionnaires and the therapists completed the Therapist Rating Scale at initial baseline assessment and again at three-month follow-up.
Results
Demographic details of the participants are presented in Table 1. Of the 82 clients, 30 were diagnosed with Borderline Personality Disorder, 14 with PTSD and 11 with Major Depressive Disorder. Other diagnoses were infrequent. More than half of the sample had engaged in deliberate self-harm.
Preliminary inspection of the data set elicited from 85 participants showed 3 distinct outliers in the responses to the initial WBSI measure. Given the high Kurtosis score for baseline WBSI responses it was deemed appropriate to evaluate the influence of these three individuals on the distribution. Analyses undertaken with data sets from both time-points comparing the responses including outliers and with them removed showed that inclusion of the outliers had a significant influence on the results overall. And yet the three outliers showed no pattern or consistency of response and appeared to be responding quite randomly. In order to prevent undue bias on the data set as a whole it was considered necessary to remove these 3 outliers from further analysis. Hence, all analyses below are derived from the 82 clients described in Table 1.
Table 2 shows the statistically significant changes to the measures between measurement time points. Pre- and Post- measures refer to baseline and 3 month follow-up measures respectively. All measured variables show highly significant change over time and all the variables indicate client improvement achieved during therapy (e.g. higher AAQ score at time 2 indicates a lowering of EA).
| |
Mean Pre-Post Difference |
t |
df |
p |
| AAQ |
-5.259 |
-4.985 |
80 |
.000 |
| WBSI |
4.605 |
6.780 |
80 |
.000 |
| DERSTotal |
14.938 |
6.177 |
80 |
.000 |
| Therapist RS |
2.691 |
6.874 |
80 |
.000 |
Table 2: Paired Samples t-test.
Preparatory to modelling procedures a correlation matrix was generated (Table 3) in order to evaluate the relationships between the measured variables. Significant correlations between all measures at pre-therapy and follow-up (post) indicated strong relationships between the variables.
| S.NO |
Measure |
M |
SD |
1 |
2 |
3 |
4 |
5 |
6 |
7 |
8 |
| 1 |
PreAAQ |
29.23 |
9.820 |
1.000 |
|
|
|
|
|
|
|
| 2 |
PostAAQ |
34.48 |
11.187 |
.601** |
1.000 |
|
|
|
|
|
|
| 3 |
PreWBSI |
61.22 |
8.551 |
-.536** |
-.513** |
1.000 |
|
|
|
|
|
| 4 |
PostWBSI |
56.79 |
10.273 |
-.323** |
-.611** |
.804** |
1.000 |
|
|
|
|
| 5 |
PreDERST |
119.23 |
26.210 |
-.682** |
-.561** |
.605** |
.460** |
1.000 |
|
|
|
| 6 |
PostDERST |
104.44 |
26.941 |
-.408** |
-.698** |
.561** |
.703** |
.664** |
1.000 |
|
|
| 7 |
PreThRS |
21.18 |
4.712 |
-.505** |
-.489** |
.323** |
.272* |
.498** |
.335** |
1.000 |
|
| 8 |
PostThRS |
18.56 |
4.393 |
-.327** |
-.578** |
.282* |
.429** |
.358** |
.536** |
.702** |
1.000 |
Note: Pre = baseline interval; Post = 3 month follow-up interval
AAQ = Acceptance and Action Questionnaire
WBSI = White Bear Suppression Inventory
DERST = Difficulties in Emotion Regulation Scale Total Score
ThRS = Therapist Rating Scale
Table 3: Means, Standard Deviations, and Correlations.
Structural equation modelling (SEM) using IBM SPSS AMOS (Arbuckle, 2011) [45] was used to estimate relationship strength between variables. The criteria for model evaluation were the p-value of chi-square (χ 2 ); the comparative fit index (CFI); the root mean square error of approximation (RMSEA) (Hu & Bentler, 1999; Hair, Black, Babin, Anderson, 2010; Steiger, 2007) [46, 47, 48] and the Tucker-Lewis Index (TLI) (Hooper, Coughlan, Mullen, 2008) [49]. The Akaike Information Criterion (AIC) was also compared, with smaller values suggesting well-fitting parsimonious models (Hooper, et al., 2008) [49]. The criteria for an acceptable model fit were taken as CFI value greater than .94 and RMSEA value lower than .07, - after Hu & Bentler (1999) [46]. However, since the possibility of type I and type II errors for any evaluation criterion varies with model complexity and sample size, these values should be considered as guidelines rather than absolute cut-off values (Hu & Bentler, 1999) [46]. Prior to SEM procedures, difference scores measuring differences between pre- and post- measures were calculated for each scale.
Initially, a saturated model was generated. The hypothesized model was a path model exploring how the change in AAQ-II scores influenced the change in the other scale scores. Items with low regression weights were removed from the measurement model until a good fit was obtained. Non-significant paths were removed and a model built to represent our hypothesised model (AAQ Model) (Figure 1). This model produced a RMSEA of 0.0, and all other goodness of fit statistics indicated that it was an excellent fit to these data.
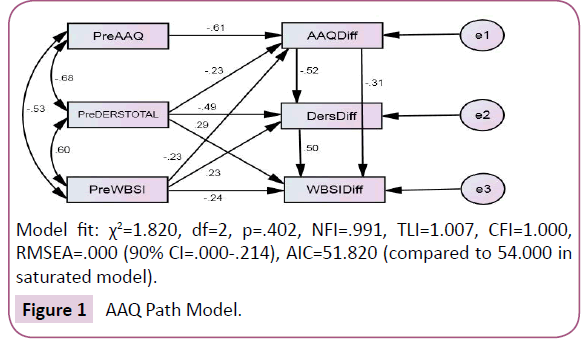
Model fit: χ2=1.820, df=2, p=.402, NFI=.991, TLI=1.007, CFI=1.000, RMSEA=.000 (90% CI=.000-.214), AIC=51.820 (compared to 54.000 in saturated model).
Figure 1: AAQ Path Model.
Two alternative models explored how the change in DERS Total scores and change in WBSI scores influenced change in other scale scores. However, the goodness of fit statistics indicated that the AAQ Model was a better fit than the alternatives - (Model fit for DERS model: χ 2=4.49, df=3, p=.213, NFI=.979, TLI=.962, CFI=.992, RMSEA=.078 (90% CI=.000-.217), AIC=52.493. Model fit for WBSI model: χ 2=4.00, df=3, p=.261, NFI=.981, TLI=.974, CFI=.995, RMSEA=.064 (90% CI=.000-.208), AIC=52.002).
The AAQ-II scale scores at baseline were the only baseline scores to exert a significant effect on the change between AAQ-II scores on pre to post measurement (β=-0.610, p<0.005). The change in AAQ-II scores between baseline and follow-up exerted a significant effect on the change in both DERS Total scores (β=- 0.517, p<0.005) and WBSI scores (β=-0.313, p=0.002). Although, the effect on WBSI change score was not as strong as on the change in DERS Total score. The effect of the AAQ-II and DERS Total scores at baseline on the change scores for the AAQ-II and DERS Total scores were highly significant. The effect of the WBSI score at baseline measurement on the change in WBSI score, whilst statistically significant, was not as strong an effect.
The consistency of measurement models between pre and post measures was explored. A latent variable of EA was generated with the AAQ, WBSI and DERS Total scores as the manifest indicators (Figure 2). Figure 2 shows that all three scales loaded well on EA at both measurement times. However, the AAQ-II and DERS Total scores showed stronger loadings than the WBSI.
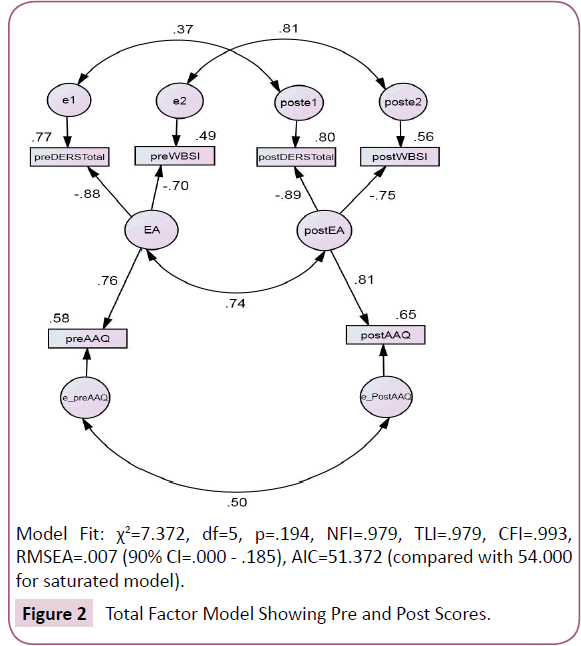
Model Fit: χ2=7.372, df=5, p=.194, NFI=.979, TLI=.979, CFI=.993, RMSEA=.007 (90% CI=.000 - .185), AIC=51.372 (compared with 54.000 for saturated model).
Figure 2: Total Factor Model Showing Pre and Post Scores.
The subscales of the DERS were also assessed. Figure 3 shows the strongest DERS subscale loadings on EA, as well as the AAQ and WBSI scores. Both models showed adequate goodness of fit statistics. The DERS-S subscale, which reflects limited access to emotion regulation strategies, was the highest loading on EA. Again, the WBSI scores demonstrated the lowest loading on EA.
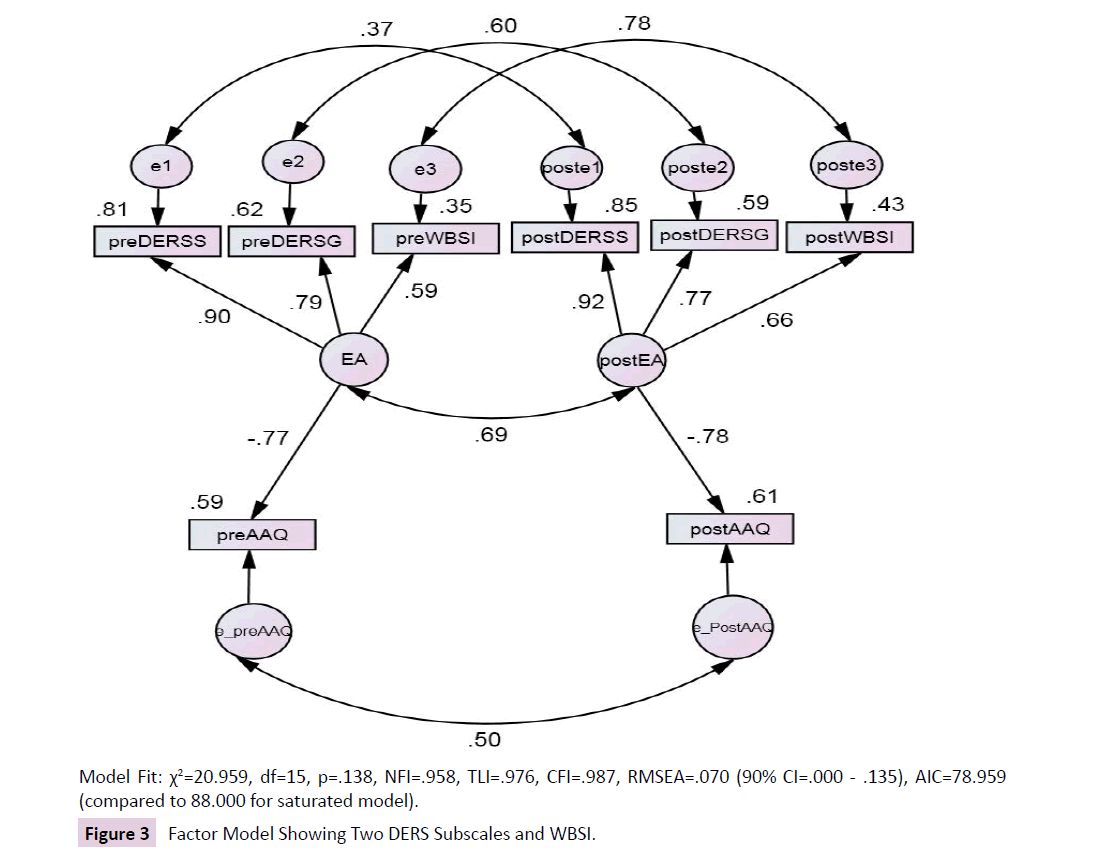
Model Fit: χ220.959, df=15, p=.138, NFI=.958, TLI=.976, CFI=.987, RMSEA=.070 (90% CI=.000 - .135), AIC=78.959 (compared to 88.000 for saturated model).
Figure 3: Factor Model Showing Two DERS Subscales and WBSI.
Given the disproportionate numbers of clients with BPD, an analysis was executed with BPD participants excluded (Figure 4). The small sample size makes extrapolation from this analysis highly tentative, nevertheless, the effects of the WBSI on change in EA increased with BPD clients removed. That is, the removal of participants with clear emotional dysregulation increased the importance of the cognitive loading on EA. However, the strength of association of the DERS subscales still surpassed that of the WBSI scores.
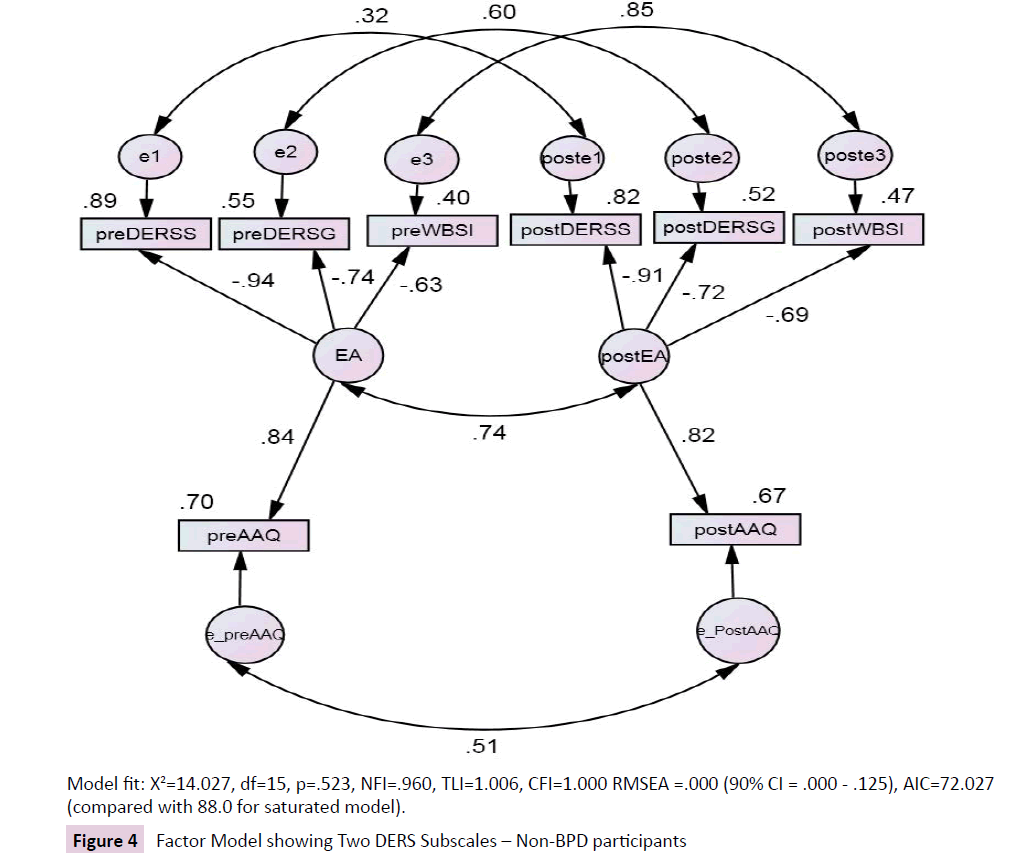
Model Fit: χ2=14.027, df=15, p=.523, NFI=.960, TLI=1.006, CFI=1.000 RMSEA =.000 (90% CI = .000 - .125), AIC=72.027 (compared with 88.0 for saturated model).
Figure 4: Factor Model showing Two DERS Subscales – Non-BPD participants
Finally, the therapists’ estimates of change in their client’s EA strategies showed significant correlation with change on each of the self-report measures. Although this is not a validated measure, the result indicates that the therapists perceived their clients as having reduced their avoidance.
Discussion
There are several shortcomings to this study, chief amongst them being the small sample size, the diagnostic biases within the sample and the absence of a control group. The small sample raises difficulties in drawing general conclusions from the modelling process (Jackson 2003; Kline 2011) [50, 51]. However, the highly prescribed and targeted nature of the sample should allow interpretation of these data for similar clinical groups. The diagnostic biases within the sample, particularly the large proportion of participants with BPD, need to be borne in mind when considering the role of emotional dysregulation in the avoidance measures. This bias was not anticipated, but came as a consequence of using a convenience sample of participants who were referred to public community mental health and psychiatric health service facilities for on-going mental health problems. The bias then reflects the diagnostic characteristics of client groups using these facilities. Finally, our inability to use an appropriate control group means that we cannot attribute any health improvement during the experimental period directly to therapeutic intervention. This problem was anticipated, but engaging a waitlist control group was not possible since it meant withholding treatment of public patients for a period of 3 months – an unacceptable condition for the health services involved. In spite of these problems the current study has revealed interpretable results that bear careful consideration.
The aim of the study was to compare the change in overall EA, as measured by the AAQ-II, with changes in measures of emotional avoidance (DERS) and cognitive avoidance (WBSI) before and after a period of 12 weeks of therapy. A significant change in the total scores for all 3 scales was found over the 12-week period. Changes in scores on the AAQ-II were strongly related to changes in the DERS total scores, although the relationship between changes in the AAQ-II and the WBSI scores was somewhat weaker. The fact that the relationship between the AAQ-II and the DERS was not perfect, and there was a relationship (albeit weaker) between the AAQ-II and the WBSI, suggest that changes in the AAQ-II may be predicted by both domains of emotion control and thought control. The fact that the elements of emotional avoidance and cognitive avoidance can be differentiated supports the notion of the multidimensionality of the AAQ-II, which follows from the research of Gamez et al (2011) [25]. Moreover, the differences between the models of the whole sample versus the non-BPD data are consistent with the differential effects of affective and cognitive control – suggesting that the multidimensionality of EA is not merely a function of structural issues as suggested by some authors (Bond, et al., 2011) [20].
Using structural equation modelling techniques, the relationship between the scales showed that the DERS total scores were more strongly related to EA than the AAQ-II scores. Exploration of individual DERS subscale scores indicated that subscales measuring lack of access to emotion regulation strategies (DERS-S) and difficulties engaging in goal-directed behaviours (DERS-G) were more strongly related to EA than the AAQ-II and the WBSI, indicating that therapeutic changes made by participants in this sample were associated more with overcoming emotional avoidance than with overcoming cognitive avoidance. Pinto-Gouveia and colleagues (Pinto-Gouveia, Gregorio, Dinis, Xavier, 2012) [52] have also recently reported that the DERS subscales measuring limited access to emotion regulation were highly correlated with a measure of EA. However, their results for the DERS-G subscale were only weakly correlated. Given the established association of BPD with emotion regulation and emotional control difficulties (Linehan, 1993) [53], the large proportion of participants with a diagnosis of BPD in this sample has doubtless reinforced this association in these data. This was also indicated by the analysis of the non-BPD scores, where the loading of the WBSI score associated with EA change increased relative to the whole group analysis.
In summary, our data indicate that all 3 scales are strongly associated with the latent variable of EA; that the AAQ-II is sensitive to at least two elements of EA, namely affective avoidance and cognitive avoidance; and that the DERS and its subscales are highly sensitive to affective avoidance. A major finding of the current study is that all 3 scales are sensitive to changes brought about during a period of therapeutic intervention. Whether this change is wholly or partly a function of time, of therapy or of a combination of these and extraneous factors is a question for further research.
References
- Wegner DM, Schneider DJ, Carter SR, White TL (1987) Paradoxical effects of thought suppression. J PersSocPsychol53:5-13.
- Gross JJ (1998) Antecedent- and response-focused emotion regulation: Divergent consequences for experience, expression, and physiology. J PersSocPsychol 74:224-237.
- Leventhal AM (2008) Sadness, depression, and avoidance behavior. Behavior Modification 32:759-779.
- Simpson T, Jakupcak M, Luterek JA (2006) Fear and avoidance of internal experiences among patients with substance use disorders and PTSD: The centrality of anxiety sensitivity. J Trauma Stress19:481-491.
- Hayes SC, Wilson KW, Gifford EV, Follette VM, Strosahl K (1996) Experiential avoidance and behavioral disorders: A functional dimensional approach to diagnosis and treatment. J Consult ClinPsychol 64:1152-1168.
- Hayes SC, Strosahl K, Wilson KG (1999) Acceptance and Commitment Therapy: An experiential approach to behavior change. New York: Guilford Press.
- Roemer L, Salters K, Raffa S, Orsillo SM (2005) Fear and avoidance of internal experiences in GAD: Preliminary tests of a conceptual model. Cognitive Therapy and Research 29:71-88.
- Borkovec TD, Roemer L (1995) Perceived functions of worry among generalized anxiety disorder subjects: Distraction from emotion topics? J BehavTherExp Psychiatry 26:25-30.
- Orcutt HK, Pickett SM, Pope EB (2005) Experiential avoidance and forgiveness as mediators in the relation between traumatic interpersonal events and posttraumatic stress disorder. Journal of Social and Clinical Psychology 24:1003-1029.
- Lynch TR, Robins CJ, Morse JQ, Krause ED (2001)A mediational model relating affect intensity, emotion inhibition, and psychological distress. Behavior Therapy 32:519-536.
- Chapman AL, Gratz KL, Brown MZ (2006) Solving the puzzle of deliberate self-harm: The experiential avoidance model. Behav Res Ther 44:371-394.
- Cooper ML, Russell M, Skinner JB, Frone MR,Mudar P (1992) Stress and alcohol use: Moderating effects of gender, coping. and alcohol expectancies. J AbnormPsychol 101:139-152.
- Chapman AL, Specht MW, CellucciT (2005) Borderline personality disorder and self-harm: Does experiential avoidance play a role? Suicide Life Threat Behav 35:388–399.
- Rüsch N, Schiel S, Corrigan PW, Leihener F, Jacob GA, et al. (2008) Predictors of dropout from inpatient dialectical behavior therapy among women with borderline personality disorder. J BehavTherExp Psychiatry 39:497-503.
- Greenberg LS, Pascual-Leone A (2006) Emotion in psychotherapy: A practice-friendly research review. J ClinPsychol 62:611-630.
- Beck JS (1995) Cognitive therapy – Basics and beyond. New York: Guilford.
- Shahar B, Herr NR (2011) Depressive symptoms predict inflexibly high levels of experiential avoidance in response to daily negative affect: a daily diary study. Behav Res Ther 49:676-681.
- Bond FW, Hayes SC, Baer RA, Carpenter KM, Guenole N et al. (2009) Preliminary psychometric properties of the Acceptance and Action Questionnaire-II: A revised measure of psychological flexibility and acceptance.
- Fledderus M, Oude Voshaar MAH, Ten Klooster PM, Bohlmeijer ET (2012) Further evaluation of the psychometric properties of the Acceptance and Action Questionnaire-II. Psychol Assess24:925-936.
- Bond FW, Hayes SC, Baer RA, Carpenter KM, Guenole N,et al. (2011) Preliminary psychometric properties of the Acceptance and Action Questionnaire-II: A revised measure of psychological inflexibility and experiential avoidance. BehavTher 42:676-688.
- McCracken LM, Zhao-O’Brien J (2010) General psychological acceptance and chronic pain: There is more to accept than pain itself.Eur J Pain 14:170-175.
- Chawla N, Ostafin BD (2007)Experiential avoidance as a functional dimensional approach to psychopathology: An empirical review.J ClinPsychol 63:871-890.
- Blalock JA, Joiner TE (2000) Interaction of cognitive avoidance coping and stress in predicting depression/anxiety. Cognitive Therapy and Research 24:47-65.
- Ottenbreit ND, Dobson KS (2004) Avoidance and depression: The construction of the Cognitive-Behavioral Avoidance Scale.Behav Res Ther 42:293-313.
- Gamez W, Chmielewski M, Kotov R, Ruggero C, Watson D (2011) Development of a measure of experiential avoidance: The Multidimensional Experiential Avoidance Questionnaire. Psychol Assess 23:692-713.
- Wegner DM, Zanakos S (1994)Chronic thought suppression. J Pers 62:615-640.
- Gratz KL, Roemer L (2004) Multidimensional assessment of emotion regulation and dysregulation: Development, factor structure, and initial validation of the difficulties in emotion regulation scale. Journal of Psychopathology&Behavioral Assessment 26:41-54.
- American Psychiatric Association (2000). Diagnostic and Statistical Manual of Mental Disorders, (4th Ed- Text Revision; DSM-IV-TR).Washington, DC: American Psychiatric Association.
- Hayes SC, Strosahl K, Wilson KG, Bissett RT, Pistorello J, et al. (2004) Measuring experiential avoidance: A preliminary test of a working model. The Psychological Record 54:553-578.
- Iverson KM, Follette VM, Pistorello J, Fruzzetti AE (2012)An investigation of experiential avoidance, emotion dysregulation, and distress tolerance in young adult outpatients with Borderline Personality Disorder symptoms. Personal Disord 3:415-422.
- Wenzlaff RM, Luxton DD (2003)The role of thought suppression in depressive rumination. Cognitive Therapy and Research 27:293-308.
- Van der Does AJW (2005) Thought suppression and cognitive vulnerability to depression. Br J ClinPsychol 44:1-14.
- Amstadter AB, Vernon LL (2008) A preliminary examination of thoughts suppression, emotion regulation, and coping in a trauma exposed sample. J Aggress Maltreat Trauma 17:279-295.
- Tull MT, Gratz KL, Salters K, Roemer L (2004) The role of experiential avoidance in posttraumatic stress symptoms and symptoms of depression, anxiety, and somatization. J NervMent Dis 192:754-761.
- Rassin E, Muris P, Schmidt H, Merckelbach H (2000) Relationships between thought-action fusion and thought suppression, and obsessive-compulsive symptoms: A structural equation modeling approach. Behav Res Ther 38:889-897.
- Nixon R, Menne A, Kling L, Steele A, Barnes J, et al. (2008) Metacognition, working memory, and thought suppression in acute stress disorder. Australian Journal of Psychology 60:168-174.
- Gratz KL, Rosenthal MZ, Tull MT, Lejuez CW, Gunderson JG (2006) An experimental investigation of emotion dysregulation in Borderline Personality Disorder. J AbnormPsychol115:850-855.
- Gratz KL, Gunderson JG (2006) Preliminary data on an acceptance-based emotion regulation group intervention for deliberate self-harm among women with Borderline Personality Disorder. BehavTher 37:25-35.
- Ehring T, Fischer S, Schnüelle J, Bösterling A, Tuschen-Caffier B (2008) Characteristics of emotion regulation in recovered depressed versus never depressed individuals. Personality and Individual Differences 44:1574-1584.
- Harrison A, Sullivan S, Tchanturia K, Treasure J (2009) Emotion regulation in Anorexia Nervosa. ClinPsycholPsychother 16:348-356.
- Tull MT, Roemer L (2007) Emotion regulation difficulties associated with the experience of uncued panic attacks: Evidence of experiential avoidance, emotional nonacceptance, and decreased emotional clarity. BehavTher 38:378-391.
- Salters-Pedneault K, Roemer L, Tull MT, Rucker L, Mennin DS (2006) Evidence of broad deficits in emotion regulation associated with chronic worry and generalized anxiety disorder. Cognitive Therapy and Research 30:469-480.
- Tull MT, Barrett HM, McMillan ES, Roemer L (2007) A preliminary investigation of the relationship between emotion regulation difficulties and posttraumatic stress symptoms. BehavTher 38:303-313.
- Ehring T, Quack D (2010) Emotion regulation difficulties in trauma survivors: The role of trauma type and PTSD symptom severity. Behavior Therapy 41:587-598.
- Arbuckle JL (2011) IBM SPSS AMOS user’s guide. Chicago, Illinois: SmallWaters Corporation.
- Hu LT, Bentler P (1999)Cutoff criteria for fit indexes in covariance structure analysis: Conventional criteria versus new alternatives. Structural Equation Modeling 6:1-55.
- Hair JF, Black WC, Babin BJ, Anderson RE (2010) Multivariate data analysis: A global perspective. Upper Saddle River, NJ: Pearson.
- Steiger JH (2007) Understanding the limitations of global fit assessment in structural equation modeling. Personality and Individual Differences 42:893-898.
- Hooper D, Coughlan J, Mullen MR (2008) Structural equation modelling: Guidelines for determining model fit. Electronic Journal of Business Research Methods 6:53-60.
- Jackson D (2003) Revisiting sample size and number of parameter estimates: Some support for the N;q hypothesis. Structural Equation Modeling 10:128-141.
- Kline RB (2011) Principles and practice of structural equation modeling (3rd Edn.). New York: Guilford Press.
- Pinto-Gouveia J, Gregorio S, Dinis A, Xavier A (2012) Experiential avoidance in clinical and non-clinical samples: AAQ-II Portuguese Version. International Journal of Psychology and Psychological Therapy 12: 139-156.
- Linehan MM (1993) Cognitive-behavioral Treatment of Borderline Personality Disorder. New York: Guilford Press.