Keywords
Equitable accessibility; Network and spatial
analysis; Medical geography; Rural health; Modeling
Background
Only less than 8% of the 100 million people who would get
benefits from palliative care worldwide in each year can access
the service [1]. Even though we all wish for a pain-free and
dignified death, this is denied to the majority of humans today as
90% of the world’s morphine is used by 16% of the population.
This is a shameful reflection and situation on our species, which
is revealing our entrenched emphasis on curative treatment
while ignoring the inevitability of death.
Throughout the world, policy makers and clinicians faced
with limited resources, favour strategies and actions that
prioritize the diagnosis and treatment of illnesses wherever they
can save lives. Thus, even in many high-income countries, end of-
life care is left to the charitable and voluntary sector, which
have to underscore its importance and are responsible for the
majority of the funding [2]. As a result, dying is still seen as a
sign of the failure in practically all health systems, leaving as a
remote possibility the realization that dying well is an essential
duty of a caring and civilized society [3].
Even in places where palliative care exists, availability of
services does not mean, automatically, that such services are
equally accessible to the population that needs the services.
One of the key elements that needs to be taken into account
during the study of disparities, particularly at the end of life, is
geography, as accessibility of health services is often influenced
by the distances that people have to travel, and the time it takes
them to reach them, as well as by the spatial distribution of health care providers and the patients who could benefit from
their services [4].
Location-related issues, however, are rarely addressed
by health equity research, as most efforts tend to focus on
describing and analyzing the distribution of social determinants
of health [5]. The methodology we describe here attempts
to fill current niche, by bringing together, simultaneously,
mapping technologies, indices of equity and estimates of time
to access physical facilities and professionals, with and without
administrative restrictions. Such approach could be of great
value to anyone interested in optimizing potential accessibility
of services (the aggregate health resources that are available in
the area, regardless of their use), to ensure that the actual use of
the services available in a given location matches the needs of
the population at end of life equitably [6].
Extremadura (Spain) is a region with clear geographical and
demographic handicaps, as defined by the European Union (EU)
itself. This region is defined by a very low population density (26
in hab/km2), motivated by the dispersion of its inhabitants and
the concentration of most of them in small towns, taking only
one exceeds the 150.000 inhabitants. In addition, demographic
ageing, reduced or zero average annual population growth rate,
the emigration of the young population, the high unemployment
rate, or the large proportion of population occupied in the
Administration, are other factors that make the daily evolution
of the Extremadura region [7].
Only few references have been found in areas of study
with similar characteristics and features (albeit density), such
as some works developed in the coastal counties of Australia
[8,9]. The remaining corresponds to crowded cities and with
a very different demographic and economic dynamics or to
regions with similar characteristics. Hence, the fact that the
methodology used based on the literature review carried out,
to deviate from the existing literature today briefly. In rural
and more remote areas, there is a need to provide services for
palliative care due to the long distance and time of access to the
resource population. In the region of Canada, study has shown
the need for resources of CP in nearly 50 regions [10].
Methods
The geographic context for the study was the Autonomous
Community of Extremadura, Spain. This region has had a
palliative care program fully integrated into the public health
care system since 2002, which resulted from a decision by local
health care authorities to guarantee full palliative care coverage
as a basic right. Services are organized in eight “health areas”,
with a palliative care team each, which operates under the
direction of a regional coordinator, and is supplemented by
mobile teams operating from eight acute care hospitals (Figure
1). The provision of palliative care in Extremadura is based on
need alone, and is not conditioned by the patient's geographical
location, his or her condition or disease, or on the ability to pay.
Figure 1: Health ordination in the region of Extremadura: Public health areas and palliative care services.
Achieving this goal has been challenging, not only because of
the limited resources available, particularly since the beginning
of the economic crisis, but also because of the negative growth
and low density of a rapidly ageing population (Figure 1) [7].
The software used to generate the model and mapping was
the generic geographic information system, ArcGIS 10, used as
a network and as a spatial analysis tool.
The spatial data were drawn from the geodetic system ED50
(European Datum 1950) and the Universal Transverse Mercator
(UTM) cartographic projection, projected in the 30 spindle for
the study area.
The basic unit of analysis was the municipality, including
relevant data in both the supply and demand side. Each
municipality was represented by the centroid of the urban core;
using coordinates provided the National Geographical Institute
in each case [11]. The total population of each municipality was
estimated based on data from the 2009 Municipal Register [12].
The limits of each of the health services areas were set by
aggregating data included in the inventory of Primary Care
Centers of the Spanish Ministry of Health and Social Policy
[13].
The tolerance used to project the punctual elements on the
network was 2.5 km. The impedance was calculated by dividing
the span length between the same specific speeds, obtaining the
time that takes to pass through a given road portion.
The road network mapping used in this study was based on
data generated by our research group during the evaluation of
the accessibility of centers of economic activity in mainland
Spain in 2008 [14].
The cartography included all the roads of Portugal and
other regions of Spain to allow the generation of an open
communication model.
From the above elements, a transport model was established
by defining the tolerance to project-specific elements on the
network and by assigning impedance to each segment of the
network. From the impedance data, the time separating two
locations within the transport model was estimated, enabling
the creation of a matrix of origin-to-destination times for the
entire region.
The matrix of origin-to-destination times is defined by
the municipalities (as a source) and palliative care services
located in the hospital of reference (as a target). The centroids
of the municipalities have been weighted on the basis of the
claimant population, although only has been conducted in
those with more than 10,000 inhabitants. On the other hand,
in these municipalities it has been considered also the weight
of the population that each one of the census districts defined
by the INE, aiming at much closer to the reality of the density
and flow that present major cities in its different spaces. The
weighting has been held in the municipalities of less than 10,000
inhabitants because it has been considered that the population
entity, the density or movement of these flows would not effect
on the results of the matrix, especially when they are having the lower socio-economic dynamism of the region.
The estimate of the urban time has been calculated
considering this travel time as variable depending on the
characteristics of the urban core. Since the time analysis carried
out in this research considers all the urban areas of Extremadura
and the peninsular centres of economic activity. In considering
the density of resident population, the running speed and radius
of the urban surface, so much for the urban nucleus that receives
the station of departure as that of arrival, are departing from
the premise from that all the urban areas are considered to be
circular. The population of each municipality is obtained from
the municipal census relative to the year of 2011 and the urban
surface of the National Cartographic Base, 1:200,000 scales.
These travel times are estimated based on the population density
of the areas, through a linear fit that allocates a maximum of
80 km/h to the areas of lower density and a minimum of 20
km/h to the more populous ones [14,15].
For estimates of the time to access a particular service
located within the same municipality, the urban displacement
time in that municipality was counted only once. Calculations
of the time required to access a health facility that requires
transportation across municipalities were obtained from
estimates of the time by road between them, as well as the time
urban time within each of them.
Data on each of the palliative care services were obtained
from existing official directories, including:
• Name and location of the site, equipment or resource
• Resource type: Palliative care unit, clinical support teams
(hospital-based, home-based or mixed), psychosocial
support teams, service coordination, research teams, day
units or rehabilitation facilities
• Financing model: Publicly-funded hospitals, private
hospitals in agreement with the National Health Services
or private hospitals without agreement
• Staffing: number of physicians, nurses, psychologists,
social workers and other health professionals
• Number of beds, whenever relevant
• Expected level of population and geographic coverage
assigned by the regional health authority [16].
The accessibility indicators were selected based on a
typological classification proposed for key health services in
Mexico, modified to account, simultaneously, for determinants
of supply (professionals and physical resources) and demand
(population) (Table 1) [16].
| Am |
Indicator of accessibility |
| (mu) |
Municipality m |
| Umu |
Number of user in Municipality m accessing the resource of u for all the municipalities that are within the time limit of resource u |
| Pu |
Partition of resource by users who have access to the same resource |
| Popm |
Population in each municipality |
| Tdmu |
Time required by municipality m to access resource u |
| Tl |
Time limit (1 h) |
| Ru |
Number of professionals available in unit u |
| Mc |
Municipality coverage |
| j |
Services available in a municipality |
| Ospj |
Occupation rate (expressed as a percentage) of a given service |
| Mdpj |
Population serviced by each municipality |
| Ns |
Number of services |
| At |
Access time expressed in minutes |
Table 1: Abbreviations of the variables/indicators.
The geographical indicator of accessibility (Am), per 100,000
people, was calculated thus:
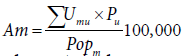
where Amis the accessibility in Municipality m (mu); Umu is the
users accessing the resources available in Municipality (mu); Pu is the partition of the resource by users who have access to the
same resource; Popm is the population of m.
This approach avoids having to assign a population
exclusively to a single resource and to consider the distance or
access time involved in each case.
The level of user access to a resource (Umu) was estimated as
a function of time. It was assumed that municipalities that are
more than one hour away were not used; that is, the population
accessing it was equal to 0 min. Similarly, it was assumed that
municipalities that were 0 min away from a resource could
serve the entire population. For the rest, direct interpolation in
time function was achieved thus
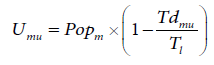
where Tdmu is the time required by municipality m to access
resource u; Tl is the time limit (1 h).
As the friction of the distance causes likely following
a complex curvilinear pattern, with less marked falls in very
long and very short distances, it was assumed that a linear loss
could provide a reasonable easy-to-understand approximation,
particularly given the lack of actual data on which to apply a
friction component model.
Finally, the participation of a resource according to the
number of users accessing it (Pu) was assumed to depend
on its size and the total number of users that can access all
the municipalities that were within the time limit as shown
below:
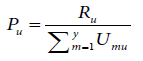
where Ru is the number of professionals available in unit u; Umu is the number of users in Municipality m accessing the
resource u and all the municipalities that are within the time
limit of resource u.
Although, in principle, any resident can attend any health
facility, anywhere in the region, a number of additional
assumptions about accessibility were made. The actual
accessibility level, for instance, depends not only on geographical
factors but also on administrative ones. Thus, two equity models were established: one estimating coverage with barriers created
by internal management and another without such barriers.
The level of municipality coverage, Mc, was obtained on the
basis of the distance between the municipality of residence of
the potential user and the location of the service as follows:
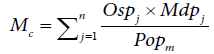
where j corresponds to the services available in a municipality;
Ospj is the occupation rate (expressed as a percentage) of a given
service; Mdpj is the population serviced by each municipality; Popm is the population in each municipality. The level of service
occupation (in percentages) is given by:
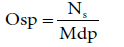
where Ns is the number of services. So, the population
serviced by a municipality is calculated thus:
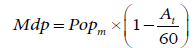
This is only calculated by a service if it takes less than 60
min and is included within the established administrative barrier.
Access time (At) is expressed in minutes. If it is true that most of
the literature advocates locked in 30 min the limit or the uptake
of health services demand barrier, it is no less true that there are
also other authors which extend this up to 60 min, especiallys
when the study area presents a considerable expansion and a
low population density as it is the case [8,9,17,18].
The indicators can be used to calculate the level of
accessibility with administrative restrictions imposed by
internal management decisions, or without such barriers. In
the restricted model, residents can only be supported by the
service/equipment/resource, organizationally assigned by their
corresponding municipality. In the unrestricted model, mapping
and graphical representations of the potential accessibility for
the population remove internal administrative constraints for
services, ensuring that hospital-based teams would always
be available to patients within 60 min of travel time, while
assuming a linear loss.
The variables can then be displayed in exposed thematic cartography with perceptive properties well suited to represent
the type of quantitative information generated by the formulas.
In addition, a manual interval method is used to illustrate the
variables in the legend as a logical and statistically consistent
way.
The distribution of the values on the map follows an
interpolation method based on the inverse of the distance
weighted (IDW), assigning weights to the data in inverse
function of the distance to a particular service point. In relation
to the accessibility of the population to the resources, the
indicator of minimum time access allows to determine how long
it takes to reach the nearest service.
To improve the ease of interpretability of the maps, Lorenz
curves and Gini indices were added [19,18,20]. The former was
obtained by dividing the coverage range into ten equal parts and
representing each decile of coverage along the horizontal axis
with the percentage of the total available to the population on
the ordinate axis. The Gini index was estimated according to the
methods proposed by for grouped data, with zero corresponding
to perfect equality (everyone has access to the same resources)
and 1 corresponding to perfect inequality (only one person has
all the resources and the others have nothing) [20,21].
Results
The first analysis we conducted focused on potential
accessibility based on the time required to reach a service from the municipality of origin. Here, the findings for hospitalbased
teams is shown in Figure 2. In this map analyzed, the
color scheme allows the differentiation among time ranges,
in minutes, across municipalities that have the same distance
to a particular resource. In Extremadura (Spain) as a whole,
the minimum average access time of all municipalities to the
closest palliative care services was estimated at 33 min, while
the maximum was 81 min, much better than the national figures
(minimum average time of 41 min and maximum average time
of 130 min). As it could be seen in the same map analyzed, in
the frontier territory there are also areas with very low values
of potential accessibility. These areas have less developed
communication channels or more rugged terrain. As expected,
accessibility decreases the farther municipalities are from a city
with palliative care services available (Figure 2).
Figure 2: Minimal time of access: Population to the palliative care hospital service.
The map describes the access times to the nearest hospitalbased
teams, averaged over all municipalities in a given health
area, disregarding their population size. In this case, the minimum
average of the eight health areas is 33 min, while the maximum
is 64 min (in the Don Benito–Villanueva area). Once again, these
data compare favourably with the national average times, where
the maximum average times shoot up to 98 min. This measure
of accessibility, which does not account for the population in
the municipalities, could be a fair measure of localization in
equidistance terms, but not in relation to the level of service
demand. Obviously, this approach favours smaller areas, provided
that they are adequately equipped (or supplied) (Figure 3).
Figure 3: Average by areas of travel time access: Population to the palliative care hospital service.
The various accessibility levels for the population when
internal administrative constraints for services were removed
and the corresponding Gini indices and Lorenz curves. The
average number of accessible resources within 60 min of travel
time was 0.6 with a maximum of 1.4. When compared with
national estimates, the mean value is slightly lower at 0.5, with
a much greater difference in relation to the maximum number,
2.6, for mainland Spain as a whole (Figure 4 and 5).
Figure 4: Coverage without barrier management of palliative care hospital service.
Figure 5: Distribution of the population according to coverage.
Administrative constraints were associated with reduced
accessibility in terms of the proportion of the population that
could access the nearest resource within 30 min, or that had to
travel more than 60 min to do so, as compared with the natural,
unrestricted conditions (Figure 5 and Table 2).
| Comparative access indicator in Extremadura |
| |
Without restrictions |
With restrictions |
| Average Coverage (resources per 100,000 inhabitants) |
0.82 |
0.82 |
| Gini index |
0.27 |
0.32 |
| Mean time to the nearest resource (min) |
21.6 |
21.6 |
| People needing to travel less than 30 min to reach the nearest resource |
76.9% |
69.6% |
| People needing to travel more than 60 min to reach the nearest resource |
2.6% |
4.9% |
Table 2: Comparative access indicator in Extremadura.
To conclude, it seems essential to include a table that compares the total population residing in each of the areas of health and
the population that accesses the services of palliative care with
or without administrative barriers in the analysis. Only in this
way the politicians and managers linked to the health services
in the Extremadura region can use the valuable information
presented here. The tremendous illustrator of the differences
that exist applying barriers defined by the administration with
regard to access to health services, in this case offered palliative
care in referral hospitals, and if the same shall not apply. The
claimant population of the services with or without barrier in
each of the areas of health can be seen in the table. Likewise, it
can be also shown in the same degree of coverage. There is no
doubt this table would be of greater assistance to policy makers
in the face of their actions in order to promote equity in access
to health services (Table 3).
| Public health area |
Population 2009 |
Demand without barriers (Population) |
Coverage without barriers |
Demand with barriers |
Coverage with barriers |
| Badajoz |
270,317 |
296,737 |
1.098 |
175,269 |
0.648 |
| Caceres |
198,409 |
243,548 |
1.228 |
123,504 |
0.622 |
| Coria |
47,979 |
52,110 |
1.086 |
34,216 |
0.713 |
| Don Benito-Villanueva |
142,040 |
113,951 |
0.802 |
81,841 |
0.576 |
| Llerena-Zafra |
106,731 |
83,220 |
0.780 |
64,674 |
0.606 |
| Merida |
166,158 |
281,818 |
1.696 |
112,084 |
0.675 |
| Navalmoral |
54,630 |
56,049 |
1.026 |
|
|
| de la Mata |
|
|
|
41,415 |
0.758 |
| Plasencia |
111,480 |
148, 067 |
1.328 |
77,006 |
0.691 |
| Total |
1,097,744 |
1,275,499 |
1.162 |
710,009 |
0.647 |
Table 3: Differences that exist applying barriers defined by the administration with regard to access to health services.
Conclusion
The methodological approach we have described here
illustrated with real-world data, complements more traditional,
descriptive and static methods that rely on the absolute amount
of resources in a given region to plan and deploy palliative care
services. The simultaneous use of maps of accessibility and
coverage, illustrating the relative distribution of the resources
in the population, while displaying the levels of coverage
according to access time to physical facilities and professionals,
with and without administrative restrictions, could be of great
value to decision makers attempting to promote optimal levels
of equity in a large, low-density geographic area.
It was intriguing to see how administrative constraints may
lead to decreased access to services and equity. If confirmed
by prospective studies, this finding could act as a cautionary
message to well-intentioned policy makers hoping to level the
playing field for people at the end of life.
The methodology we have presented here could also be of
value to decision-makers interested in equitable provision of
other kinds of services in other regions of the world [10,22].
The user-friendly process could also make it attractive as
a means to simulate future scenarios before the deployment
of services in vast geographic areas. By enabling the “virtual”
manipulation of modifiable variables such as the geographic
boundaries of a service area, or the number of health
professionals in a particular facility, this approach could help
ensure that potential accessibility does, in fact, reflect the
level of received accessibility, without additional cost, while
reassuring the public about the value added by political and
administrative decisions that intend to promote equitable access
to crucial services.
The proposed methodology is a theoretical model that has
not been validated by health professionals or political managers
from the modification of the guidelines that indicate the
existence of administrative barriers in access to health services.
The proposed theoretical foundation must be validated for
comparison with cases that already have been implemented in
other regions or cities in the world.
However, it remains less certain that this research is
based on a study commissioned by the Ministry of Health in
2009 consultant, expert managers of the health systems of the
different Autonomous Communities and teachers from many
Spanish nationwide universities. On the other hand, while it
developed work, aiming to go by participant to the national
health community, several interviews and surveys were
conducted to know their opinions. In the case of Extremadura,
interviewed the five heads of the Extremadura Health Services
in issues related to palliative care, which not only opined
about the State of the Service at that particular moment, but
it is also involved in the development and the first results of
the theoretical methodological proposal was carried out in
the region showing at all times compliance with the process
followed. Obviously, political decision-makers are ultimately
responsible for applying or not all the studies that are carried out on questions as delicate and difficult to implement as the healthrelated.
However, having the support of leading practitioners
in the region is already an important step towards possible
encounters and meetings to discuss its implementation.
To conclude, it is necessary to accept the patent limitation
that defines, in a way, the scarcity of sources for regions with
socio-economic characteristics such as exposed here. However,
this research continues to be evident the need of studies as the
here exposed face to alleviating healthcare deficiencies of the
population resident in these most depressed areas. The same
National Government, as expressed in the evaluation of the
national strategy for palliative care of the national system of
health, speaks of the need to expand the range of resources
throughout the country and improve its efficiency and territorial
cohesion [23,24].
Competing Interests
The authors declare that they have no competing interests.
Authors’ Contributions
FJJC drafted the manuscript, made the analysis and
interpretation of data and performed its statistical analysis.
JAGG participated in the design of the study, made substantial
contributions to the acquisition of data, performed the statistical
analysis and helped to draft the manuscript. EHM conceived
the study, participated in its design and coordination and helped
to draft the manuscript. SLF participated in the design of the
study, revised it critically and helped to draft the manuscript.
JSJ and ARJ revised the manuscript for important intellectual
content and provided linguistic support. All the authors read and
approved the final manuscript.
Acknowledgement
The authors are grateful to Dr. Félix Fernández who
designed the statistical analysis and revised the manuscript
critically for content accuracy. This publication was sponsored
by the Regional Government of Extremadura and the European
Regional Development Found (Ref. GR15121).
References
- Worldwide Palliative Care Alliance.
- Hughes-Hallett T, Craft A, Davies C (2011) Creating a fair and transparent funding system; the final report of the palliative care funding review. Department of Health, United Kingdom.
- Hughes-Hallett T, Murray SA, Cleary J (2013) Transforming end-of-life care through innovation. World Innovation Summit for Health.
- Wang F, Luo W (2005) Assessing spatial and non-spatial factors for healthcare access: Towards an integrated approach to defining health professional shortage areas. Health Place. 11: 131-146.
- Pons-Vigués M, Diez È, Morrison J (2014) Social and health policies or interventions to tackle health inequalities in European cities: A scoping review. BMC Public Health. 14:198.
- Khan AA (1992) An integrated approach to measuring potential spatial access to health care services. Socioecon Plann Sci. 26: 275-287.
- Herrera E, Rocafort J, De Lima L (2007) Regional palliative care program in Extremadura: An effective public health care model in a sparsely populated region. J Pain Symptom Manage. 33: 591-598.
- Schuurman N, Fiedler RS, Grzybowski SCW (2006) Defining rational hospital catchments for non-urban areas based on travel-time. Int J Health Geogr. 5:43.
- Pilcher J, Kruske S, Barclay L (2014) A review of rural and remote health service indexes: Are they relevant for the development of an Australian rural birth index? BMC Health Serv Res. 14: 548.
- Cinnamon J, Schuurman N, Crooks VA (2009) Assessing the suitability of host communities for secondary palliative care hubs: A location analysis model. Health Place. 15: 822-830.
- Centro Nacional de Información Geográfica - CNIG (2010) Información Cartográfica de España, 2010 (Spanish Cartographic Information, 2010). Madrid: Instituto Geográfico Nacional, Ministerio de Fomento.
- Instituto Nacional de Estadística - INE (2008) Estadística del Padrón Continuo, 2008 (Municipal Register Statistics, 2008). Madrid: Ministerio de Ciencia e Innovación.
- Secretaría General de Información Sanitaria e Innovación (2010) Ordenación Sanitaria del Territorio en las comunidades autónomas. Sistema de Información de Atención Primaria (SIAP) (Territorial management health in the regions. Primary Health Care Information System). Año 2010. Madrid: Ministerio de Sanidad y Política Social.
- Gutiérrez J, Condeço-Melhorado A, López E (2011) Evaluating the European added value of TEN-T projects: a methodological proposal based on spatial spillovers, accessibility and GIS.J Transp Geogr.19: 840-850.
- Gutiérrez-Gallego JA, Naranjo-Gómez JM, Jaraíz-Cabanillas FJ (2015) A methodology to assess the connectivity caused by a transportation infrastructure: Application to the high-speed rail in Extremadura. CSTP. 3: 392-401.
- Enterprise Solutions for Health (2010) Estudio sobre la equidad y la accesibilidad en el desarrollo de recursos de cuidados paliativos en el Sistema Nacional de Salud (Study on equity and accessibility in the resources development of palliative care in the National Health System). Madrid: Ministerio de Sanidad y Consumo.
- Garrocho C, Campos J (2006) Un indicador de accesibilidad a unidades de servicios clave para ciudades mexicanas: Fundamentos, diseño y aplicación (An indicator of accessibility to key service units in Mexican cities: Fundaments, design and application). Revista Economía, Sociedad y Territorio. 22: 349-397.
- Wan N, Zou B, Sternberg T (2012) A three-step floating catchment area method for analyzing spatial access to health services. Int J Geogr Inf Sci. 26: 1073-1089.
- Donaldson D, Weymark JA (1980) A single-parameter generalization of the Gini indices of inequality. J Econ Theory. 22: 67-86.
- Gupta MR (1984) Functional form for estimating the Lorenz curve. Econometrica. 52: 1313-1314.
- Ahmad Kiadaliri A, Najafi B, Haghparast-Bidgoli H (2011) Geographic distribution of need and access to health care in rural population: An ecological study in Iran. Int J Equity Health.
- Ferreira E, Garín MA (1997) Una nota sobre el cálculo del Indice de Gini (A note on the calculation of the Gini index). Estadística Española. 39: 207-218.
- Dixon J, King D, Matosevic T (2015) Equity in the provision of palliative care in the UK: Review of evidence. Personal Social Services Research Unit, London School of Economics and Political Science.
- MHA (2012) Evaluación de la estrategia de cuidados paliativos del sistema nacional de salud. Agencia de evaluación y calidad. Ministerio de Hacienda y Administraciones Públicas.