Keywords
Milk composition; Raw milk; Fat; Protein;
Lactose; Solid-not-fat and Total solid; pH; Specific gravity;
Freezing point
Introduction
The world ’ s milk is predominantly produced from cows
followed by buffalo milk [1]. Several factors including genetics,
breed of animal, environment, stages of lactation, parity, and
nutrition, together determine the final composition of milk [2].
According to COMESSA [3] milk is defined as the normal, clean
and fresh secretion, without any addition or subtraction,
extracted from the udder of a healthy cow, and free from
colostrum. Apart from being important for the nutrition of the
young, milk-borne biologically active compounds such as
casein and whey proteins have been found to be increasingly
important for physiological and biochemical functions that
have crucial impacts on human metabolism and health [4].
These compounds have been found to be useful in guarding
humans against pathogens and illnesses [5]. Milk is made up of
a complex mixture of fats, proteins, carbohydrates, minerals,
vitamins and other miscellaneous constituents dispersed in
water [6]. The composition of cows’ milk is of the greatest
importance for the dairy industry, since, its process ability is
highly influenced by composition. Moreover milk quality and
safety are important consumer requirements [7]. Therefore
knowing the physical parameters and composition of milk in
conformity with consumer’s requirements helps to assure the
status of milk suitability either for milk processing industries or
consumers. Enough studies have not been reported on the
physicochemical composition of milk marketed in study areas.
Therefore, in this study, investigation of various physical
parameters and chemical components of available milk
samples were collected to determine the condition of cow milk
commonly used. The findings were also compared with
Ethiopian quality standards and European quality standards.
Methods
Study sites
The study was conducted at Sebeta and Bishoftu towns in
the central high lands of Ethiopia.
Sebeta Awas wereda: is located at a distance 25 km away in
the south West of Addis Ababa in the Oromia Regional state.
Sebeta town is its administrative center. The town is situated
at latitude and longitude of 8°55 ′ N 38°37 ′ E and 8.917°N
38.617°E respectively. The average elevation of Sebeta town is
2405 m a.s.l. and temperature of 22°C.
Bishoftu town is located at a distance of 45 km South East of
Addis Ababa, Ethiopia. The town is located in the east Showa
zone of Oromia region at about 9° North latitude and 40° East
longitude at an altitude of 1850 m above sea level in the
central high land of Ethiopia. It has an annual rainfall of 866
mm of which 84% is in the long rainy season (June to
September) and the remaining in the short rainy season
extending from March to May. The dry season extends from
October to February. The mean annual maximum minimum
temperatures of the area are 26°C and 14°C respectively, with
a mean relative humidity of 61.3%. The mixed farming system
followed in the area, crop and livestock production is an
intensive type of production. Cattle, small ruminant, poultry
and equines are the major livestock species kept with fastgrowing
smallholder dairy production [8]. The total population
of Ada`a district is 131,273 [9]. As information obtained from
the district agricultural office revealed, the total livestock
population of the district in 2007 was 291,539 of which both
local and crossbred cows accounted for 11.68%. The area is
certainly the most developed milk shed of the country,
providing most of the dairy products available in the market of
Addis Ababa, the largest and most diversified market of
Ethiopia [10].
Sources of data and sampling techniques
The data sources of the study were dairy farms, milk
collectors, milk and milk product market around the study
area. Accordingly, all of the dairy farms, milk vendors and
owners/workers of both the farms and vendors were supposed
as sources of data. Raw, pasteurized milk and other milk
product samples were collected from July 2017 to August
2018. Raw milk samples were collected from pooled
containers of dairy farms and bulk tank containers of milk
collectors. However, pasteurized milk samples were collected
from shops and supermarkets. All the samples were collected
using a random sampling method following the procedures
below.
All samples were subsequently analyzed in the Dairy
Laboratory of Holleta Agricultural research center.
Milk sample size determination and sample
collection
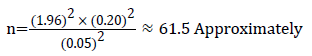
A formula of Kothari [11] for unknown population (i.e.
n=Z2SD2/e2) was used to calculate the sample size for this
study. Where Z, is the estimated standard variation at 95%
Confidence Interval (CI) which will be considered the point of
the normal distribution corresponding to the level of
significance (Z=1.96). Standard deviation (SD) was estimated at
0.20 or 20% and e, is the estimated error and will be considered at 0.05 or 5%. Therefore, the sample size ‘n’ will be
calculated as:
n=62 samples of milk and milk products were collected per
each district while 62 samples of milk products will also be
collected from market sources in Addis Ababa.
About 112 samples (that is 100 from raw milk and 12 from
pasteurized) each containing 250 ml milk samples collected
using sterile bottles and placed in an icebox as per the
recommendations of IDF [12]. Raw milk samples were
collected directly from pooled farm milk containers of the
dairy farms (30 from Sebeta and 30 from Bishoftu) urban areas
and bulk tank milk collectors’ containers (20 from Sebeta and
20 from Bishoftu). A total of 12 samples of pasteurized milk
were also collected from different branded pasteurized milk.
About 250 ml of fresh raw milk samples were taken twice at
different times aseptically from each dairy farm and milk
vendor in two months interval. Similarly, 250 ml of pasteurized
milk samples were taken twice at different times from similar
dairy processing brands. After aseptically collecting the milk
samples with sterile bottles, samples were transported to
Holleta Agricultural Research Center Dairy Laboratory for
Physicochemical analysis. Upon arrival at the laboratory, the
milk samples were divided into two and used for the
determination of physicochemical properties.
Milk composition analysis
Analyses for physicochemical properties of milk were
performed at Holleta Agricultural Research Center Dairy
Laboratory using a Lacto scan to determine the percentage
composition density, freezing points, pH, lactose, protein, total
fat, total solid and Ash. Percent Solids-not-fat was calculated
by the following formulas: %SNF=%Total solids–% Fat.
Data management and statistical analysis
The data obtained was tabulated and analyzed using the
General Linear Model (GLM) procedure of the Statistical
Analysis System version 9.1 [13]. Mean separation were
carried out using the Least Significant Difference (LSD)
technique when analysis of variance (ANOVA) shows
significant differences between means. Differences were
considered statistically significant at 5, 1, and/or 0.1%
significance level. The following models were used for the milk
physicochemical data:
Yijk=μ+αi+βj+eijk
Where Yijk=individual observation for each sample
μ=the overall mean
αi=the ith milk and milk product sources sites effects (i.e
Sebeta, Bishoftu, supermarket in Addi s Ababa)
βj=the jth milk and milk product sample type effect (raw
milk, pasteurized milk)
eij=the error term.
Results and Discussion
Hydrogen ion concentration (pH)
The Mean ± (SEM) of the pH of milk sampled from the
Sebeta and Bishoftu area is shown in Table 1. The milk
collected from the Sebeta area had an average milk pH of 6.28,
whereas the milk from the Bishoftu area had a pH of 6.49. Milk
samples from the Bishoftu area farm pooled were significantly
higher in pH than the other types of samples. Milk samples
from the Bishoftu area were slightly below the required
standard but of Sebeta area was more acidic. A similar study
from the Shashamene area reported pH value better than
Sebeta and almost similar to Bishoftu’s area farm pooled type
of this study [14]. According to East African Standards, the
recommended raw cow milk pH is 6.6 to 6.8 which can
withstand the boiling temperature [15]. There are many
factors that can make the raw cow milk acidic, but the major
one is poor storage under room temperature which
accelerates microbial activities on lactose to be converted to
lactic acid [16]. Sometimes, low pH of milk may be due to the
presence of high levels of casein, acid phosphates, and citrates
and carbon dioxide [17,18].
| Study sites |
N |
Sp. gravity |
Freezing pt. |
pH |
| Sebeta |
|
|
|
|
| Farm pooled |
30 |
1.029b ± 0.000 |
-0.528b ± 0.008 |
6.28b ± 0.07 |
| Bulk tank |
20 |
1.033a ± 0.002 |
-0.619a ± 0.024 |
6.28b ± 0.04 |
| Bishoftu |
|
|
|
|
| Farm pooled |
30 |
1.028bc ± 0.00 |
-0.525b ± 0.005 |
6.56a ± 0.05 |
| Bulk tank |
20 |
1.026c ± 0.001 |
-0.486b ± 0.012 |
6.31b ± 0.02 |
| Pasteurized |
12 |
1.023d ± 0.001 |
-0.422c ± 0.023 |
6.01c ± 0.41 |
| Significance |
|
*** |
*** |
*** |
*=p<0.05; **=p<0.01; ***=p<0.001; NS=Non-Significant; LS Mean=Least Square Mean; SE=Standard Error; a,b,c,d: means in the same column with different subscript letters were significantly different
Table 1: Mean ± (SEM) raw and pasteurized milk preliminary quality tests of Sebeta and Bishoftu areas.
Specific gravity
The Mean ± (SEM) of the specific gravity of milk sampled
from the Sebeta and Bishoftu area is shown in Table 1. There was a significant difference (p<0.001) in specific gravity among
the study areas and the value of specific gravity in general falls
within the ranges of Ethiopian Standard (ES) value but
pasteurized milk was significantly lower in specific gravity than
the raw milk and lower than the standard (Table 1). Sebeta
areas sample of bulk tank milk (1.033+0.02) was significantly
higher than the other and out of the standards [19]. A similar
finding was reported from Shashamene for milk collected from
small scale milk producers and dairy cooperative milk
collection centers [14]. More similar results of 1.030 were
reported from on-farm study results [20]. Opposing these
results below 1.026 of specific gravity was also reported from
Dairy Farms in Pemba Island Zanzibar of Tanzania [21].
Freezing point
The Mean ± (SEM) freezing point of milk sampled from
Sebeta and Bishoftu area is shown in Table 1. In this study,
relatively the freezing point of the Sebeta area (-0.619°C) milk
was significantly (p<0.01) lower than that of the Bishoftu area
(-0.486°C) Table 1. The freezing point of milk is determined
primarily either to prove milk adulteration with water or to
determine the amount of water added [22]. Similarly, the
freezing point of milk is used as one of the quality criteria for
insuring high-quality milk [23]. There might be adulterations of
solutes in Sebeta area milk samples whereas water
adulteration in milk might be high in Bishoftu area samples.
The figures of these findings, particularly of Sebeta samples,
were found to be out of the ranges of average reported milk
freezing point -0.540°C [19,24].
Lactose percentage of milk samples
The overall lactose percent of milk sampled from the Sebeta
and Bishoftu area is shown in Table 2. The lactose percentage
of milk sampled from the Sebeta area (4.91 ± 0.12) was higher
than that of Bishoftu areas (4.36 ± 0.06) (Table 2). Milk
sampled from the sebeta area was significantly higher for
lactose percent than Bishiftu areas and pasteurized milk
samples. Earlier reports for lactose content (4.24%) showed
lower results than percent of lactose with that of Sebeta areas whereas comparable with the current study result of the
Bishoftu area [25]. A similar study result from the Shashamene
area reported that the overall lactose percent of 4.43+0.06
which is almost similar to that of the Bishoftu area but less
than that of the Sebeta Area finding [14]. The result of this
study is greater than that of the overall Lactose% value (4.28 ±
0.08%) reported from Amanuel Town of Ethiopia [26].
| Study sites |
N |
Lactose |
Protein |
Fat |
SNF |
TS |
Ash |
| Sebeta |
|
|
|
|
|
|
|
| Farm pooled |
30 |
4.57b ± 0.06 |
3.05b ± 0.04 |
3.50ab ± 0.23 |
8.31b ± 0.11 |
11.81b ± 0.26 |
0.69b ± 0.01 |
| Bulk tank |
20 |
5.25a ± 0.18 |
3.50a ± 0.12 |
3.86a ± 0.27 |
9.54a ± 0.33 |
13.40a ± 0.56 |
0.79a ± 0.03 |
| Overall seb. |
50 |
4.91 ± 0.12 |
3.28 ± 0.08 |
3.68 ± 0.25 |
8.93 ± 0.22 |
12.61 ± 0.41 |
0.74 ± 0.02 |
| Bishoftu |
|
|
|
|
|
|
|
| Farm pooled |
30 |
4.51bc ± 0.03 |
3.00bc ± 0.02 |
3.49ab ± 0.11 |
8.21bc ± 0.05 |
11.70b ± 0.13 |
0.68bc ± 0.00 |
| Bulk tank |
20 |
4.21c ± 0.09 |
2.80c ± 0.06 |
3.69ab ± 0.15 |
7.65c ± 0.16 |
11.34b ± 0.27 |
0.63c ± 0.01 |
| Overall Bish. |
50 |
4.36 ± 0.06 |
2.90 ± 0.04 |
3.59 ± 0.13 |
7.93 ± 0.11 |
11.52 ± 0.20 |
0.66 ± 0.01 |
| Pasteurized |
12 |
3.72d ± 0.19 |
2.48d ± 0.12 |
3.01b ± 0.15 |
6.77d ± 0.33 |
9.78c ± 0.47 |
0.56d ± 0.03 |
| Significance |
|
*** |
*** |
NS |
*** |
*** |
*** |
*=p<0.05; **=p<0.01; ***=p<0.001; NS=Non Significant; LS mean=Least Square mean; SE=Standard Error; a,b,c,d: means in the same column with different subscript letters were significantly different
Table 2: Mean ± (SEM) raw and pasteurized milk composition content of Sebeta and Bishoftu areas.
The protein percentage of milk samples
The overall Protein percent composition of milk sampled
from the Sebeta and Bishoftu area is shown in Table 2. The
protein percentage of milk sampled from the Sebeta area (3.28
± 0.08) was higher than that of Bishoftu areas (2.90 ± 0.04)
(Table 2). There was a significant difference in protein %,
values between the study areas and milk samples (p<0.01)
with a higher percentage record from Sebeta areas. Milk
sampled from the bulk tank of the Sebeta area has the highest
protein percent and lowest record of protein percent for milk
recorded for pasteurized milk. The overall values of this study
for protein% sampled from Sebeta areas agree with Ethiopian
standard values (3.2%) but higher than that of European Union
quality standards (2.73%). Protein percent of milk sampled
from Bishoftu areas was less than values (3.2%) of Ethiopian
standard but higher than that of European Union quality
standards [19]. Almost a similar figure with the current finding
of the Sebeta Area was reported by Dehinenet G et al. where
protein percentage was 3.12 ± 0.32 of milk samples from the
Godino and Babogaya [27]. The previous study reported a
higher value of 5.61% protein for Borana × Friesian from the
Holetta area [28]. The results of this study is greater than that
of the overall protein percent values (2.83 ± 0.06%) reported
[26] from Amanuel Town of Ethiopia.
The fat percentage of examined milk samples
The overall Fat percent composition of milk sampled from
the Sebeta and Bishoftu area is shown in Table 2. The fat
percentage of milk sampled from the Sebeta area (3.68 ±
0.25) was higher than that of Bishoftu areas (3.59 ± 0.13)
(Table 2). The overall values of this study for Fat % sampled
from Sebeta areas higher than that of Ethiopian standard
values (3.5%) and European Union (EU) quality standards
(3.25%) [19]. But for Bishoftu areas almost similar to that of
Ethiopian standard values (3.5%) and but higher than that of
European Union quality standards (3.25%) [19]. However, it is
less than the finding of Asaminew Tassew, who reported 4.14
fat percent for crossbred cows' milk from Bahir Dar milk shed
[29]. Greater result (4.12 ± 0.26%) for the overall average value
of fat was reported by Desyibelew W and Wondifraw Z from
Amanuel Town of Ethiopia [27].
Solids not fat (SNF) percentage of examined
milk samples
The overall Solid Not Fat percent composition of milk
sampled from the Sebeta and Bishoftu area is shown in Table 2. The solid Non-Fat percentage composition of milk sampled
from the Sebeta area (8.93 ± 0.22) was higher than that of
Bishoftu areas (7.93 ± 0.11). The overall values of this study for
SNF% sampled from Sebeta areas (8.93 ± 0.22) were higher
than that of the Bishoftu area (7.93 ± 0.11) and European
Union (EU) quality standards (8.25%) [19]. But milk sampled
from the Bishoftu area was less than that of the European
Union (EU) quality standards (8.25%) [19]. Comparable results
with the Sebeta area were also reported by Dehinenet G et al.
[27] for solid not fat percentage (8.88 ± 0.83) of milk samples from the Godino and Babogaya. Higher SNF results than the
current one were also reported by Helen Nigussie for SNF
contents (10.7%) for cows' milk in Kombolcha woreda [30]. In
addition, the previous study by Desyibelew W and Wondifraw Z also reported almost similar results to the current study for SNF (7.77 ± 0.14%) from Amanuel Town of Ethiopia [26].
Milk total solids percentage of examined milk
samples
The overall Total solid percent of milk sampled from the
Sebeta and Bishoftu area is shown in Table 2. The
total solid percentage composition of milk sampled from the
Sebeta area (12.61 ± 0.41) was higher than that of Bishoftu
areas (11.52 ± 0.20). The overall values of this study for Total
solid % sampled from Sebeta areas were less than the
Ethiopian standard values (12.8%) but it was in agreement
with European Union (EU) quality standards (12.5%) [19]. But
the sample result obtained from the Bishoftu area was less
than both quality standards. Higher than the current study
results were reported [31] in the Sebeta area where the overall
percentage composition of total solids (12.92+1.6). The overall
mean TS of Sebeta (12.61%) and Bishoftu (11.52%) content
obtained in this study is lower than earlier findings of [32] and
[33] that reported 13.55% and 14.31% for Boran and Horro
cows’ milk, respectively. Another report [26] for TS% (11.89 ±
0.40) also showed greater results than that of the Bishoftu
area finding but less than of Sebeta’s finding of this study.
Total ash percentage of milk
The overall Ash percent composition of milk sampled from
the Sebeta and Bishoftu area is shown in Table 2. The total Ash
percentage composition of milk sampled from the Sebeta area
(0.74 ± 0.02) was higher than that of Bishoftu areas (0.66 ±
0.02). Less than the current finding for total ash (0.59%) was
reported in our earlier study from Sebeta area [31]. The ash
content (0.74%) obtained in the current study of Sebeta area is
comparable with the findings of Derese Teressa [32] and
Asaminew Tassew [29] who reported ash content of 0.73% and
0.74% for the milk sampled from Bahir Dar milk shed and west
Shoa areas. However, the overall mean ash content obtained in
this study from the Bishoft area is lower than the findings of
Derese Teressa [32] and Asaminew Tassew [29]. The ash%
(0.63 ± 0.01) reported by Desyibelew W and Wondifraw Z in
agreement with the Bishoftu area of this study but less than
that of Sebeta areas result of this study [26].
Percentages of the physicochemical
composition of pasteurized milk
The overall percent chemical composition of milk sampled
from pasteurized milk from Addis Ababa supermarkets and
shops is shown in Table 2. Pasteurized milk was significantly
lower in milk composition for lactose, protein, Solid Non-Fat
(SNF), Total solid and ash values than the raw milk sampled
from the Bishoftu and Sebeta area of this study. The specific
gravity of this study for pasteurized milk (1.023 ± 0.001) was far below than Ethiopian Standard (1.026 to 1.032) [19]. The
freezing points of this study (-0.422+0.023) were within the
range of the standard [19] value (0.525 to 0.550). pH value
(6.01+0.41) of this study is similar to the study results reported
by Zelalem Yilma, which was pH value ranged from the lowest
5.46 to the highest 6.14 with an overall mean value of 5.87
[34]. The previous findings for the overall value of protein (2.57%) and fat (3.05%) is similar to the current study finding.
But the current study result for overall Total solid (9.78+0.47) is
far below the finding of Zelalem for Total Solids (11.10) [34].
The result of this study was not conforming to the minimum
requirement of the Ethiopian standard (ES) for protein (3.20%)
and whole milk fat (3.5%).
Correlation coefficients among the different
milk quality parameters
The overall correlation between the physicochemical
components of raw milk sampled from Sebeta and Bishoftu
town is shown in Table 3. Protein content was strongly
correlated with ash, SNF, lactose, total solids, specific gravity and freezing point of milk. This correlation appears positive
and confirms the rule that the higher protein values, the
higher the other components. The fat content of milk was
weakly correlated with protein, Ash, SNF, lactose, specific
gravity, total solid and freezing point of milk. The specific
gravity of milk was strongly correlated with protein, ash, SNF,
lactose, total solid and freezing point of milk.
| Variable |
Total Solid |
Protein |
Fat |
Ash |
SNF |
Lactose |
pH |
Sp. Gravity |
Frezg pt. |
| Total solid |
1 |
|
|
|
|
|
|
|
|
| Protein |
0.830*** |
1 |
|
|
|
|
|
|
|
| Fat |
0.820*** |
0.357** |
1 |
|
|
|
|
|
|
| Ash |
0.830*** |
0.996*** |
0.367** |
1 |
|
|
|
|
|
| SNF |
0.830*** |
0.9980*** |
0.359** |
0.994*** |
1 |
|
|
|
|
| Lactose |
0.830*** |
0.999*** |
0.364** |
0.996*** |
0.998*** |
1 |
|
|
|
| pH |
0.086NS |
0.012 NS |
0.123 NS |
0.083*** |
0.021 NS |
0.014 NS |
1 |
|
|
| Specific Gravity |
0.834*** |
0.999*** |
0.364** |
0.996*** |
0.998*** |
0.999*** |
0.014NS |
1 |
|
| Freezing pt. |
0.864*** |
0.988*** |
0.423*** |
0.984*** |
0.989*** |
0.999*** |
0.033NS |
0.988*** |
1 |
**Correlation is significant at the 0.001 level (2-tailed); ***Correlation is significant at the 0.0001 level (2 tailed); NS: have no significant difference correlation
Table 3: Frequency distribution.
Conclusion
In the present study, investigations were carried out to
ascertain the physicochemical qualities of various milk samples
marketed in Sebeta and Bishoftu areas. Milk sampled from
Sebeta areas showed significantly higher percentage for fat,
Solid Non Fat (SNF), Total solid and ash values than that of
Bishoftu. The overall mean value of milk composition in the
study area is almost similar/within the range of/to Ethiopian
standard value.
There was also a significant difference in the percentage of
lactose, protein, Solid Non-Fat (SNF), and Total solid and Ash%
values between the study areas and milk samples with the
higher percentage component from Sebeta areas. The overall
values for protein from this study area agree with Ethiopian
standard values, whereas the percentage of total solid and SNF
is slightly lower than Ethiopian standard values. In general, this
finding may be helpful for the concerned governmental parties
to monitor the quality of the milk products in the market of
Central Ethiopia. Moreover, it is to date an overview of the
physicochemical quality status of milk for collectors, dairy
factories and consumers about study sites.
Acknowledgment
The authors gratefully acknowledge Holetta Agriculture
Research center Dairy lab for supporting with laboratory
facilities of this study. Addis Ababa University College of
veterinary medicine and agriculture and Gambella University
are also acknowledged for their financial support of this study.
Great appreciation goes to the community and dairy farmers,
milk collectors and milk sellers of Sebeta and Bishoftu areas for
their unreserved cooperation during the collection of samples
for this study.
References
- Eurostat milk and milk product statistics (2018).
- Jenkins TC, McGuire MA (2006) Major advances in nutrition: Impact of milk composition. J Dairy Sci 89: 1302-1310.
- Draft COMESA/East Africa Dairy Standards on raw milk (2010).
- Gobbetti M, Stepaniak L, De Angelis M, Corsetti A, Di Cagno R (2002) Latent bioactive peptides in milk proteins: proteolytic activation and significance in dairy processing. Crit Rev Food Sci Nutr 42: 223-239.
- Park YW (2009) Bioactive components in milk and dairy products. First edition. Wiley-Blackwell publishers.
- Harding F (1999) Milk quality 2nd ed Gaithers burg, Maryland: Aspen, pp: 25-38; 104- 105.
- Malek dos Reis CB, Barreiro JR, Mestieri L, Porcionato MA, dos Santos MV (2013) Effect of somatic cell count and mastitis pathogens on milk composition in Gyr cows. BMC Vet Res 9: 1-7.
- Yigrem S, Beyene F, Tegegne A, Gebremedhin B (2008) Dairy production, processing and marketing systems of Shashemene-Dilla area, South Ethiopia. IPMS (Improving Productivity and Market Success) of Ethiopian Farmers Project Working Paper 9. ILRI Nairobi, Kenya, p: 62.
- Central Statistical Agency (2007) Agricultural sample survey of 2007 Volume II report on livestock and livestock characteristics. Centr Statis Agen, Addis Ababa, Ethiopia.
- Bekele E, Zeleke W (2008) Women entrepreneurship in micro, small and medium enterprises: The case of ethiopia. J Internat Women's Stud 10: 3-19.
- Kothari CR (2004) Research Methodology, method, and techniques. New Age International Publishers, India, pp: 175-180.
- International Development Fund (IDF) ISO 707 (2008) Milk and milk products- Determination of residue of organochlorine compounds (pesticides).
- SAS (2008) Statistical Analysis System. SAS for Windows, Release 9.1 SAS Information Inc., Cary, NC, USA.
- Gemechu T, Fikadu B, Mitku E (2015) Physical and chemical quality of raw cow’s milk produced and marketed in shashemene town southern Ethiopia. ISABB J Food Agric Sci 5: 7-13.
- East African Community (2007) East African standard, raw cow milk specification, p: 2.
- Mdegela RH, Ryoba R, Karimuribo ED, Phiri ECJ, Løken T, et al. (2009) Prevalence of clinical and subclinical mastitis and quality of milk on smallholder dairy farms in Tanzania. J S Afr Vet Assoc 80: 163-168.
- Vishweshwar SK, Krishnaiah N (2005) Quality control of milk and processing, state institute of vocational education director of intermediate education Government of Andhra Pradesh.
- Bille PG, Haradoeb BR, Shigwedha N (2009) Evaluation of chemical and bacteriological quality of raw milk from neudamm dairy farm in Namibia. AJOL 9: 1511-1523.
- Ethiopian Standard (ES) (2009) Unprocessed whole/raw cow milk specification 2nd ed ES 3460.
- Zelalem Y, Ledin I (2001) Efficiency of smallholder butter making in the Ethiopian central highland Pastoralism and Agropastoralism-which way forward; In: Proceedings of the Eighth Annual Conference of the Ethiopian Society of Animal Production 24-26 August 2000, Addis Ababa, Ethiopia, p: 192.
- Gwandu SH, Nonga HE, Mdegela RH, Katakweba AS, Suleiman TS, et al. (2018) Assessment of raw cow milk quality in smallholder dairy farms in Pemba Island Zanzibar, Tanzania. Hindawi Veterinary Medicine 2018: 1-9.
- Zagorska J, Ciprovica I (2013) Evaluation of factors affecting freezing point of milk world. Internat J Nutrit Food Engineer 7: 2-22.
- Henno M, Ots M, Jõudu I, Kaart T, Kärt O (2008) Factors affecting the freezing point stability of milk from individual cows. Internat Dairy J 18: 210-215.
- OAANC (2005) Significance of nutritional effects on the freezing point of milk. Ontario Agri-Business Association Nutrition Committee.
- Haftu KS, Degnet HM (2018) Determination of adulteration and chemical composition of raw milk sold in Hossana town, South Ethiopia. Dairy Veterin Sci J 6: 555-699.
- Desyibelew W, Wondifraw Z (2019) Evaluation of milk composition in Zebu × HF Crossbred dairy cows in different seasons and stage of lactations in Amanuel town, Ethiopia. J Agri Sci Food Res 10: 255.
- Dehinenet G, Mekonnen H, Ashenafi M, Emmanuelle G (2013) Determinants of raw milk quality under stallholder production system in selected areas of Amhara and Oromia National Regional States, Ethiopia. Agric Biol J N Am 4: 84-90.
- Mesfin R, Gojam Y (2000) Effect of supplement concentrates feeds with different ingredients for local and crossbred cows on major milk constituents. In: Proceeding of the 7th Annual Conference of the Ethiopian Society of Animal Production (ESAP). 26-27 May, Addis Ababa, Ethiopia, pp: 263-267.
- Tassew A (2007) Production, handling, traditional processing practices and quality of milk in Bahir Dar milk shed area, Ethiopia. MSc. Thesis, Haramaya University of Agriculture, Dire Dawa, Ethiopia.
- Helen Nigussie (2007) Traditional handling practices, preservation methods and evaluation of the lactoperoxidase system and container smoking on the microbial quality of cows’ and goats’ milk produced in kombolcha Woreda, Eastern Ethiopia. MSc Thesis presented to the School of Graduate Studies of Alemaya University.
- Shibru D, Mekasha Y (2016) Performance evaluation of crossbred dairy cows in urban and peri-urban dairy systems of Sebeta Awas wereda, Oromia, Ethiopia. Acad Res J Agri Sci Res 4: 184-196.
- Teressa D (2008) Present situation of urban and peri-urban milk Production and quality of raw milk produced in West Shoa zone, Oromia region, Ethiopia. MSc Thesis presented to the school of graduate studies of Alemaya University.
- Tola A (2002) Traditional milk and milk products handling practices and raw milk quality in Eastern Wollega. M.Sc. Thesis, Alemaya University, Dire Dawa, Ethiopia p: 108.
- Zelalem Yilma (2010) Quality factors that affect Ethiopian formal milk business: Experiences from selected dairy potential areas. Final Report for SNV Netherlands Development Organization.