Keywords
Liquid sensing; Electrical conductivity; Carbon nanotube; Polycarbonate; Nanocomposite
Introduction
CNT/polymer composites (CPCs) can offer several advantages in terms of good thermal, mechanical, and electrical properties, which make them suitable candidates for many advanced applications. Due to their high aspect ratios, CNTs can form an interconnected network at very low volume fractions. The lowest nanotube concentration in which such networks are first formed is known as the percolation threshold [1].
One recent application for CPCs is using them in sensor technologies. When these CPC sensors are exposed to an external condition or environment, some properties of the material (e.g. electrical conductivity) are changed [2,3]. This makes it possible to detect the exposure to the external condition. For example, CPCs can be used for sensing mechanical stress [4,5], temperature [6], gas [7,8] vapor [9,10], pH and liquid [11-15].
During their operation, CPC liquid sensors are typically exposed to solvents. When the solvent diffuses into the sample, the distance between CNTs is increased and the electrical conductivity of the sample will reduced. If this effect is identified and quantitatively characterized, it will provide means of detecting exposure to different solvents. For a given CPC to be used as a sensor, choosing the proper solvent is critical as it should not completely dissolve the sample, but rather swell it first.
Using CPCs as sensory materials for the detection of organic solvents is based on the ability of polymeric materials to swell. If a solvent can diffuse into the polymer matrix of a CPC, the resulting expansion induces an increase in the distances between neighboring CNTs, which reduces the tunneling current. Therefore, the electrical resistivity of the filler network increases as the swelling process proceeds. Exceeding the critical tunneling distance, which is about 1.8 nm, results in separation of individual CNTs and CNT clusters from the network. In the case of a dried 3D CPC sensor, the sample is immerged into a solvent, and a swelling process will be started from the surface. As the solvent diffuses into the sample, a gradient resistivity profile will be created over the cross-sectional area. Thus, assuming similar filler contents and uniform distribution, the resistance of a sensor depends on its geometry, the penetration depth of the solvent, and the direction of the current flow.
The total sample conductivity is the sum of contributions from both the core and skin regions. With increasing solvent penetration into the bulk of the sample, the cross-section of the core region reduces in size. This leads to a time dependent increase of the total sample resistivity, until a plateau is eventually reached.
The liquid sensing properties of some polymer/CNT composites have been studied in the literature. This includes studying the influence of materials composition, processing conditions, and the experimental setups [9,13,15].
In the specific case of PC/CNT nanocomposites, a model has been developed based on experimental findings, which takes into account parameters such as composite characteristics, sample geometry, and solvent diffusion kinetics. The model is capable of predicting the relative resistance change of PC/CNT composites.
In this article, we have focused on the use of CPCs as leakage detectors for organic solvents. Carbon nanotubes were added to polycarbonate to produce nanocomposites. Then the electrical properties of these nanocomposites were studied in presence of different solvents. The time dependent changes in electrical conductivity of the samples were correlated to the amount of nanotubes and the type of solvents.
Experimental Section
Materials
Multi walled carbon nanotubes (Nanocyl NC7000TM) had average specific surface area of 250-300 m2.g-1, with average diameter and length of 9.5 nm and 1.5 μm, respectively. Polycarbonate (Hopelex PC-1100) with density of 1.2 g.cm-3 and MFI of 10 g/10 min according to ASTM D 18 (1.2 kg, 300°C) was obtained from Lotte Chemical, Korea. Acetone, Tetra Hydro Furan (THF), Methyl Ethyl Ketone (MEK), and Di Chloromethane (DCM) were obtained from Merck, Germany.
Processing
Before processing, PC and MWCNTs were dried at 80°C for 24 hours. Mixing PC with MWCNTs was done using a twin-screw micro compounder (Brabender model PL2200, volume 60 cm3). Mixing was done at 250°C and 100 rpm for 10 minutes. Nanocomposites with different concentrations of MWCNTs (i.e. 0.25, 0.5, 0.75, 1, 2, 3, and 5 wt.%) were produced. The samples were then compression molded into plaques of 100 × 100 × 1 mm using a Schwabenthan hot press (Model Polystat 400s) after 4 minutes pre-heating. The samples were molded at 265°C with a pressure of 50 bars for 2 minutes.
Characterization
Morphological characterization: Microscopic morphological features of the nanocomposites, such as the dispersion, distribution and the localization of CNTs, were investigated using Transmission Electron Microscopy (TEM) (Zeiss 902). In doing so, ultra-thin sections were cut out of the samples using an ultramicrotome. For all samples, bright field TEM was carried out at an acceleration voltage of 80 kV.
Electrical resistivity measurements: Volume electrical resistivity measurements were performed using two different electrometers in order to cover a larger range of resistivity values. For values higher than 107 Ohm.cm, a Keithley Electrometer 610°C (Keithley Instruments) and for values bellow 107 Ohm. cm, a 5491 Multimeter (Precision BK Inc.) were used. Prior to each measurement, the samples and electrodes were cleaned with ethanol. The electrical conductivity of each sample was measured four times, and the results were reported as average values. Four pin probes were used in order to eliminate the effect of contact resistance and all measurements were carried out at room temperature.
Liquid sensing measurements: The Hansen solubility parameter (δT) of neat PC is about 20.2 MPa0.5 [16]. Liquid sensing performance of the nanocomposites depends on how well they can be swollen by the solvent. Therefore, four different solvents with solubility parameters close to that of PC were chosen for the liquid sensing tests. All four solvents could swell the nanocomposites; however, the magnitude of swelling was different for each solvent. The Hansen total solubility parameter of the solvents, their molar volumes and molar masses are given in Table 1. For sensing tests, the U-shaped samples were joined to the electrodes and immersed in the solvent, so that a part of the sample was immersed in the solvent and the two ends of it were connected to the electrodes.
| Solvent |
Solubility parameter (δT) (MPa0.5) |
Molar volume (mol /cm3) |
Molar mass (g/mol) |
| Acetone |
20.1 |
73.52 |
58.09 |
| DCM |
20.2 |
63.9 |
84.93 |
| MEK |
19.1 |
89.02 |
72.11 |
| THF |
19.4 |
81.02 |
72.11 |
Table 1: Specification of solvents.
The liquid sensing behavior of the CPCs was monitored by recording the resistivity change of samples during their immersion in each solvent. The values of resistivity were collected every 1 minute for 32 minutes.
Result and Discussion
Morphology
In order to better understanding of CNTs dispersion and distribution in the PC matrix, TEM micrographs were prepared. For the PC sample containing 3.0 wt.% CNTs, TEM micrographs with two different magnifications are shown in Figure 1. As it was observed the nanotubes are finely distributed in the matrix and have formed a CNTs network through the entire sample, which significantly improves the electrical conductivity. It was shown in previous works [17], that for increasing the electrical conductivity, the only good dispersion of nanotubes is not enough, and the connection between CNTs and forming a conductive network is essential too.
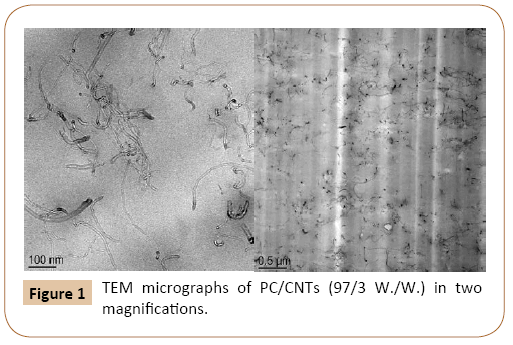
Figure 1: TEM micrographs of PC/CNTs (97/3 W./W.) in two magnifications.
For most properties, appropriate distribution and dispersion of the fillers are essential. In the case of electrical conductivity in specific, the physical network of the tubes throughout the sample volume is responsible for good electron transfer and any external factor, which is able to interrupt this network, can affect the conductivity of the system.
Electrical conductivity
The volume electrical resistivity of a sample (ρ) can be calculated using the Ohm’s law, eqn. (1):
 (1)
(1)
In which, V is the applied voltage, I is the current, l is the distance between the inside copper electrodes, finally w and t are the width and the thickness of the specimen, respectively.
As the conductive range is important for the polymer/CNT sensory properties, percolation curve characteristics in the dry state were determined. Statistical percolation theory describes the dependency of electrical conductivity on the filler concentration using a power law relation, eqn. (2) [18]:
 (2)
(2)
Where: σ(p) is the electrical conductivity for concentrations p>pc, B is the proportionality constant, pc is the electrical percolation threshold and t is a critical exponent. Using Least Square method, by guessing an amount for pc and putting it in eqn. (2), different R2 are extracted from the equation. The best amount of R2, which is more near to 1, shows the best fit and indicates the best guess for pc In other words, the linearized expression enables the determination of the variables by plotting the log (σ) versus log (p-pc) [16-20].
Figure 2a shows the variation of electrical conductivity of PC/ CNT composites as a function of CNT contents. As expected, the electrical conductivity is increased with increasing the amount of CNTs, which is due to increasing in CNT networks. Increasing the amount of CNTs, leads to form a conductive network (percolation threshold), which allows electrical currents to pass through the sample. Further addition of CNTs results in forming continuous conductive pathways throughout the matrix and a sharp increase in conductivity [20]. As observed in Figure 2a the percolation thershold of the PC/MWCNT nanocomposite is between 0.5 and 1 wt.% of CNTs.
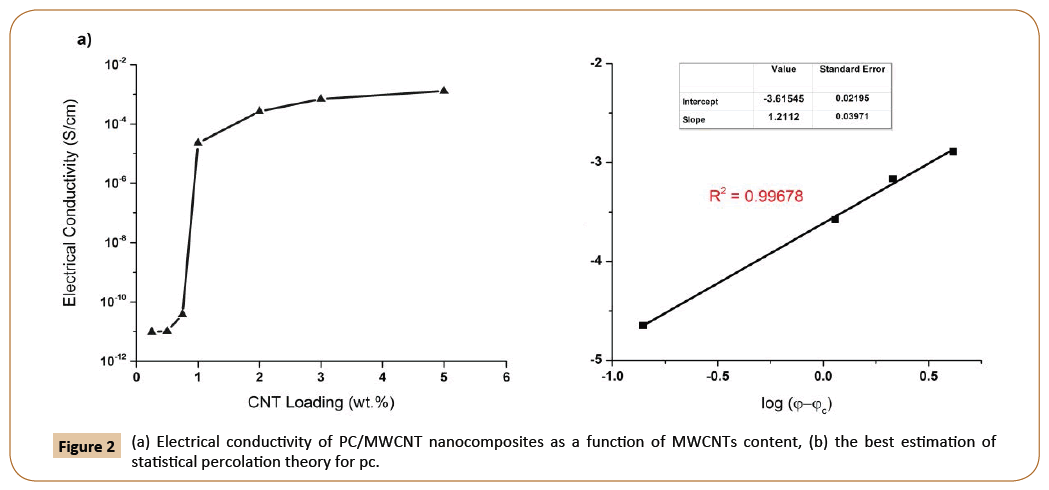
Figure 2: (a) Electrical conductivity of PC/MWCNT nanocomposites as a function of MWCNTs content, (b) the best estimation of statistical percolation theory for pc.
For comparison, the percolation threshold was also calculated using the statistical percolation theory. Using the electrical conductivity data at different CNT concentrations, the percolation threshold was calculated as 0.84 wt.% CNTs, which is in accordance with the experimental value (Figure 2b).
The high conductivity of PC/MWCNT samples can be attributed to the good distribution of CNTs in the PC matrix and their partial contact in form of light and loose clusters. In fact, better dispersion of CNTs was resulted from the proximity for connection of CNTs to their neighbors and achieving a higher conductivity and lower percolation threshold. It is known that the nanotubes content needed for percolation is strongly dependent on their ability to form an interconnected nanotube network.
Liquid sensing behavior
The most important issue in design of solvent sensor CPCs, is the choice of the proper polymer-solvent system. The similarity of solubility parameters of polymer and solvents, determines whether a specific CPC will swell when it is in contact with a specific solvent or not. The use of Hansen solubility parameters (HSP) provides a relatively clear method of quantifying the similarity of polymers and solvents. The solubility parameter δ (unit MPa0.5), terminologically introduced by Hildebrand and Scott, is defined as the square root of the cohesive energy density of a given chemical compound [21,22].
In this research, the selected solvents for PC were THF, MEK, DCM and Acetone, which have the solubility parameters near to that of PC.
In order to compare the electrical response of the composites (after immersion in different solvents) with their initial resistance values, the relative resistance change, Rrel, was calculated according to eqn. (3), where R and Ri are the actual resistance and the initial resistance of the sample, respectively.
 (3)
(3)
The effect of CNT content and solvent type on liquid sensing behavior was investigated.
Effect of CNT content: U-shaped samples of PC/MWCNT nanocomposites with different nanotube contents (1, 2, 3 and 5 wt.%) were immerged in THF at 25°C and the electrical resistance of the samples were recorded at different time intervals. The variation of relative resistance (Rrel) as a function of immersion time is shown in Figure 3. By increasing the immersion time, the relative resistance is increased in all samples. At the end of the experiments, the sample containing 1 wt.% CNTs had the largest change in resistivity (almost 200 times more resistant than the dried sample). It should be mentioned that the samples containing 3 and 5 wt.% CNTs were quite brittle and were broken after being immerged in the solvent for a few minutes. Therefore, only few early data points were possible to report for the high CNT containing samples.
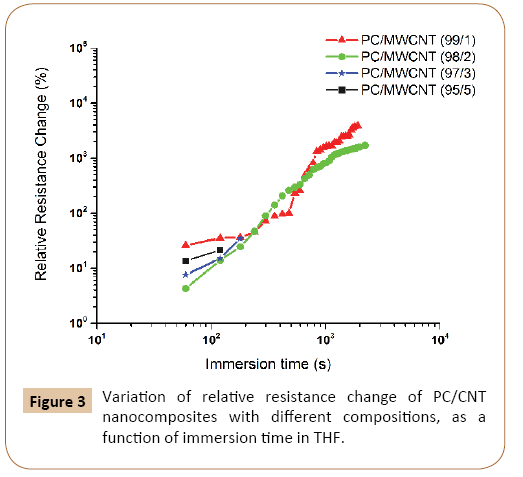
Figure 3: Variation of relative resistance change of PC/CNT nanocomposites with different compositions, as a function of immersion time in THF.
The curves in Figure 3 show similar trends for the variation of Rrel in different samples. Three different time stages could be distinguished in this figure. Stage I corresponds to the beginning of the solvent immersion process. It is characterized by a moderate increase in Rrel versus time. This period is attributed to the diffusion of solvent molecules into the bulk material. In stage II, a sharp increase is seen for Rrel, which can be attributed to the convergence of solvent fronts in the middle of the samples. This increase can be of several orders of magnitude, depending on the MWCNT content. In stage III, the relative resistance change reaches to a plateau value without any further changes.
The effect of swelling on the resistivity of samples is most significant for CNT contents close to the percolation threshold. In contrast, nanocomposites containing higher amounts of nanotubes show smaller change in their overall electrical resistance. That is why by increasing the amount of nanotubes in the samples, the penetration of solvent into the matrix will be slower and therefore, relative resistance changes will be decreased. These results are in good agreement with the other works in the literature.
Another observation is the difference in the time needed to reach the plateau in different samples. According to a previous research, assuming constant diffusion kinetics for all CPCs regardless of their CNT content, but having different initial resistances, all curves would level off at their Rrel plateau at the same time. Therefore, the reason for the shift of Rrel curves for CPCs containing different CNT contents has to be attributed to a change in diffusion kinetics.
Effect of different solvents: In addition to THF, three other solvents were chosen to study their effect on the electrical response of PC/CNT samples. As shown in the previous section, the most pronounced change in relative resistance was observed in the PC/CNT composite containig 1 wt.% of CNTs. Therefore, this sample was selected for liquid sensing measurements using different solvents and the results are shown in Figure 4.
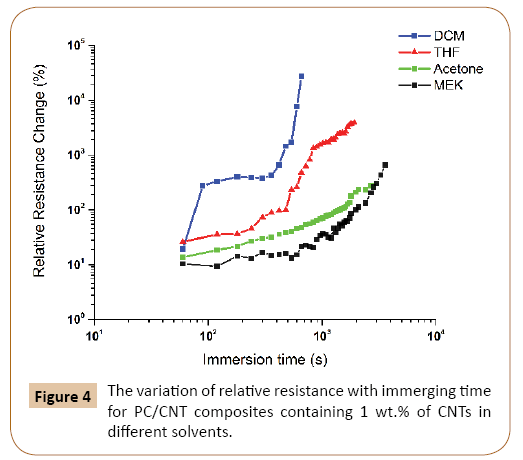
Figure 4: The variation of relative resistance with immerging time for PC/CNT composites containing 1 wt.% of CNTs in different solvents.
Results suggest that the solvents have different diffusion kinetics into the PC/MWCNT nanocomposite, with the highest strength of interaction for DCM followed by THF, acetone and MEK.
As it was shown in Figure 3, the variation of resistivity with immersion time in THF, followed a similar trend in samples containing different amounts of nanotubes, and only a vertical shift in curves was apparent. In other hand, by using different solvents, the interactions with the polymer, as well as the kinetics of diffusion, will be different. Therefore, the time shift from stage II to stage III is different for each solvent. Solvents with smaller molecule sizes or lower molar volumes can penetrate more easily into the polymer and promote the swelling processes. For example, DCM has these characteristics and interacts well with the nanocomposite, therefore, the maximum change in relative resistance and the shortest time to reach the maximum value both belong to the sample immerged in DCM. In other hand, PC and DCM have similar solubility parameters, so DCM can dissolve the polymer easily. It seems that these two characteristics of DCM lead to the highest penetration rate of this solvent to the nanocomposite network. As a result, DCM has a different behavior in comparison to other solvents and no stage III could be seen for it. In fact, the nanocomposite is partially dissolved in DCM and the change in resistivity is so large that could not be measured. As the molar volume of the solvents increase, the heights of diagrams decrease and achieving to the plateau will be delayed. That is why MEK with the highest molar volume has the lowest relative resistance change.
The results presented here for the electrical response of CPCs immersed in organic solvents and the corresponding range of influencing factors underline the complexity of the material behavior. However, this complexity enables the design of highly precise CPC based sensors for the detection of numerous organic solvents within a very broad range of temperatures, with the capability of distinguishing between different solvents.
Conclusion
According to produce a material as a sensor, the change in its properties caused by an external factor is essential. Electrically conductive materials can be used as sensors if an external factor is able to change their conductivity. In polymer nanocomposites containing CNTs (CPCs), the contact with a solvent can increase the tunneling distance between nanotubes, which leads to decrease in electrical conductivity of them. Therefore, CPCs are sensitive to the solvent penetration and they can be used for sensing various solvents due to different penetration rate of them to the polymer. A percolated system can be a good sensor but the sensitivity will be decreased by increasing the CNT content, which is because of low ability of solvent to penetrate into the dense network of CNTs. Study on solvent sensing behavior of four solvents indicated that the similarity of solubility parameters is a key factor in detection ability, and also with increasing the molar volume of solvents, the sensing properties will be decreased.
References
- Jin Z, Pramoda KP, Xu G, Goh SH (2001) Dynamic mechanical behavior of melt-processed multi-walled carbon nanotube/poly (methyl methacrylate) composites. Chem Phys Lett 337: 43-47.
- Li C, Thostenson ET, Chou TW (2008) Sensors and actuators based on carbon nanotubes and their composites: a review. Compos Sci Technol 68: 1227-1249.
- Villmow T, Pegel S, John A, Rentenberger R, Pötschke P (2011) Liquid sensing: smart polymer/CNT composites. Mater Today 14: 340-345.
- Kang I, Heung YY, Kim JH, Lee JW, Gollapudi R, et al. (2006) Introduction to carbon nanotube and nanofiber smart materials. Compos B 37: 382-394.
- Ciselli P, Lu L, Busfield JJ, Peijs T (2010) Piezoresistive polymer composites based on EPDM and MWNTs for strain sensing applications. e-Polym 10.
- Koratkar N, Modi A, Lass E, Ajayan P (2004) Temperature effects on resistance of aligned multiwalled carbon nanotube films. J Nanosci Nanotehnol 4: 744-748.
- Wanna Y, Srisukhumbowornchai N, Tuantranont A, Wisitsoraat A, Thavarungkul N, et al. (2006) The effect of carbon nanotube dispersion on CO gas sensing characteristics of polyaniline gas sensor. J Nanosci Nanotehnol 6: 3893-3896.
- Zhang T, Nix MB, Yoo BY, Deshusses MA, Myung NV (2006) Electrochemically functionalized singleâ€ÂÂÂÂwalled carbon nanotube gas sensor. Electroanal 18: 1153-1158.
- Potschke P, Andres T, Villmow T, Pegel S, Brunig H, et al. (2010) Liquid sensing properties of fibres prepared by melt spinning from poly (lactic acid) containing multi-walled carbon nanotubes. Compos Sci Technol 70: 343-349.
- Lu J, Kumar B, Castro M, Feller JF (2009) Vapour sensing with conductive polymer nanocomposites (CPC): Polycarbonate-carbon nanotubes transducers with hierarchical structure processed by spray layer by layer. Sens Actuators B 140: 451-460.
- Ferrerâ€ÂÂÂÂAnglada N, Kaempgen M, Roth S (2006) Transparent and flexible carbon nanotube/polypyrrole and carbon nanotube/polyaniline pH sensors. Phys Status Solidi A 243: 3519-3523.
- Segal E, Tchoudakov R, Narkis M, Siegmann A (2003) Sensing of liquids by electrically conductive immiscible polypropylene/thermoplastic polyurethane blends containing carbon black. J Polym Sci B 41: 1428-1440.
- Kobashi K, Villmow T, Andres T, Haußler L, Potschke P (2009) Investigation of liquid sensing mechanism of poly (lactic acid)/multi-walled carbon nanotube composite films. Smart Mater Struct 18: 035008.
- Villmow T, Pegel S, Pötschke P, Heinrich G (2011) Polymer/carbon nanotube composites for liquid sensing: model for electrical response characteristics. Polym 52: 2276-2285.
- Kobashi K, Villmow T, Andres T, Potschke P (2008) Liquid sensing of melt-processed poly (lactic acid)/multi-walled carbon nanotube composite films. Sensor Actuat B 134: 787-795.
- Hansen CM (2002) Hansen solubility parameters: a user's handbook. CRC Press.
- Abbasi Moud A, Javadi A, Nazockdast H, Fathi A, Altstaedt V (2015) Effect of dispersion and selective localization of carbon nanotubes on rheology and electrical conductivity of polyamide 6 (PA6), polypropylene (PP), and PA6/PP nanocomposites. J Polym Sci B 53: 368-378.
- Stauffer D, Aharony A (1994) Introduction to percolation theory. CRC Press.
- Kilbride BE, Coleman JN, Fraysse J, Fournet P, Cadek M, et al. (2002) Experimental observation of scaling laws for alternating current and direct current conductivity in polymer-carbon nanotube composite thin films. J Appl Phys 92: 4024-4030.
- Potschke P, Bhattacharyya AR, Janke A (2003) Morphology and electrical resistivity of melt mixed blends of polyethylene and carbon nanotube filled polycarbonate. Polym 44: 8061-8069.
- Hildebrand JH, Scott RL (1950) Solutions of nonelectrolytes. Annu Rev Phys Chem 1:75-92.
- Hildebrand JH, Scott RL (1962) Regular solutions. Prentice-Hall.