Keywords
Spain; Disaster severity score; Disaster metrics; Mass casualty incidents
Introduction
The concept of disaster metrics is used to quantify the effects of disasters [1] particularly in regards to the rescue effort. Within the scope of disaster metrics a “mass casualty incident” (MCI) or “multiple casualty incident” is one that generated more patients that overwhelms the local capacity and requires additional assistance [2], more briefly, an event in which the resulting number of victims is large enough to disrupt the normal emergency and health care services [3]. This situation is generally a subset of disaster [4], which is usually a disruption of a society in a situation where they have little or no control, the usual difference would be on the scale of the occurrence.
Spain is one of the most affluent countries with ample resources to deal with emergency services. Given the size and varied geography of the country, it is faced with multiple situations, from geological (earthquakes) meteorological (storms), climatological (hot and cold waves), industrial (accidents), technological (crashes) and human (terrorism). The latter three situations are mostly due to development and an increase in the illegal immigration to the southern shores during a period.
This study looks at the disasters occurred throughout Spain since the start of the disaster record database in 1950 and score them based on the Disaster Severity Score (DSS) [5]. We studied the practical use of the DSS in terms of the Spanish system and its real world application. This way we can quantify the Spanish response to various incidents and also put the scale to a real-world test in terms of practicality and usefulness. Also we discuss the strengths and shortcomings of both the Spanish disaster databases and the quantification methods.
Material and Methods
We used retrospective data collected from various sources to characterize the disasters that occurred within the Spanish national territory within the period from 1950 to present gathering additional data that was not provided from multiple sources including the local, national newspapers along with disaster related websites, including CRED-EMDAT [6], ReliefWeb [7] and Munich-Re [8].
Using the Disaster Severity Scale [9] and the data collected from multiple sources we assigned scores to these disaster situations based on the established parameters, excluding from our final analysis those disasters where we were unable to source all the information to complete the DSS.
To follow the established classification scheme we graded the incidents based on: (I) Effect on surrounding community as (a) Simple- the local and regional system were able to handle, and (b) Compound- national and international help were needed; (II) Number dead as number of people who died due to the event. This does not take into account the ‘expectant/T4’; (III) Number injured as number of victims who sustained some sort of nonlethal injury, but not involving psychological injuries; (IV) Radius as the area in which casualties occurred due to the event. With biological incidents that presented a problem with people who travelled; (V) Impact time as the time taken for the event to occur, usually highest in natural events and spontaneous in accidents; (VI) Rescue time as he length of time it takes rescue teams to get to victims and remove them from the area to hospitals and treatment centers; and (VI) Severity of injured based on the NATO triage system, take into account the number of patients in each category.
Data sources
Primary data came from disaster related agencies (EMDAT, ReliefWeb), insurance agencies (MAPFRE, Munich-Re), humanitarian agencies (Red Cross, and local rescue) and various governmental and non-governmental departments (Ministry of Civil Protection, Ministry of Development, Ministry of Environment). Secondary data was sourced from the local, regional and international newspapers and verified with multiple searches for the relevant mass casualty events that are described this was particularly useful for gathering basic information. The concept of MCI and the DSS was found by searching databases not limited to PubMed, Science Direct, SCOPUS, Web of Science and Research Gate reviewing bibliographies and grey literature.
Statistical Analysis was done using SPSS establishing correlations and statistical values, for statistical analysis p<0.05 was accepted as statistically significant. For all other values, the null hypothesis was rejected and considered statistically insignificant.
Results
Number of victims in manmade vs. natural
In distinguishing the ‘natural’ and ‘man-made’ disasters there are 39 phenomena that are included in the ‘natural’ category and 251 in the ‘man-made’. The number of dead victims show a similar trend with the natural events having a total of 2909 dead averaging 72.7 dead per event (s.d. 135.4) whereas man-made disasters had a total of 6078 dead with an average of 24.2 (s.d. 55.1) reflecting the lethality of the natural disasters in Spain, due mainly to the extent of the damages in geographic terms. The reverse can be seen with the number of injured whereas natural disasters totaled 1314 injured average 32.9 (s.d. 70.1) per event, the man-made situations resulted in 49871 injured with an average of 198.7 (s.d. 523).
Immigrant boats
The refugee boats that entered the Spanish territory were one of the major sources of mass casualty events during the early 2000s peaking in 2003 and tapering off since with a noticeable increase during the later 2000s approaching 2010. Rescues usually occurred in the south of the Iberian Peninsula in Andalucia (13) and the Canary Islands (24). But of these ‘disaster situations’ in the 37 rescues recorded, most were body recoveries (34/37) with only 3 having more injured than dead victims.
The number of dead ranged from 10-37 and injured from 0-32. With the average number of dead being 17.8 (s.d. 9.2) and injured 1.5 (s.d. 5.8), demonstrating the danger in using these boats to enter Spanish territory. Considering the DSS, in most cases the impact site remained confined to the boat ‘1’ but in 2 reports the impact site increased to more than 1km less than 10kms and in one case, a radius scale ‘2’ was needed. These cases were due either to bodies being dumped overboard or one member of the boat running to get help in nearby towns, of course, the data here only takes into account bodies that were found, there is no way to demonstrate or categorize bodies that were dumped overboard and never recovered.
In each report of these boat accidents, the DSS was ‘0’ in the ‘number of dead’ and ‘number of injured’ categories, indicating that the scale here is not feasible to rate such small scale situations. Of particular note is the ‘rescue time’, in multiple cases being greater than 6 hours, primarily due to the distance at sea the disaster took place. The relationship between the real world value (number of dead or injured) and the index score (Figure 1) were not interpretable as they remained ‘0’ in all cases. With respect to the number of dead and the number of injured and the disaster severity scale, there was a correlation of 0.27 and 0.16 respectively.
Natural disasters
Floods data show that the ‘rescue time’ and ‘radius’ in all cases were constant as the maximum value in the scale. ‘Impact time’ varied in one case a flashflood incident. The number of dead score remains at ‘0’ whereas the ‘absolute value’ ranged from 5-86, showing the wide range of deaths that have no effect on the scoring. With regards to the DSS the total score ranged from 6-10, primarily due to the constant values for radius, impact time and rescue time.
The number of dead and injured varied with time in flooding incidents across Spain in relation to time, with a general decrease in both these factors even with an increase in the number of flooding s of deaths and injuries were during the 1950’s to early 1980’s but there is no clear indicator for the cause of the decrease in morbidity and mortality.
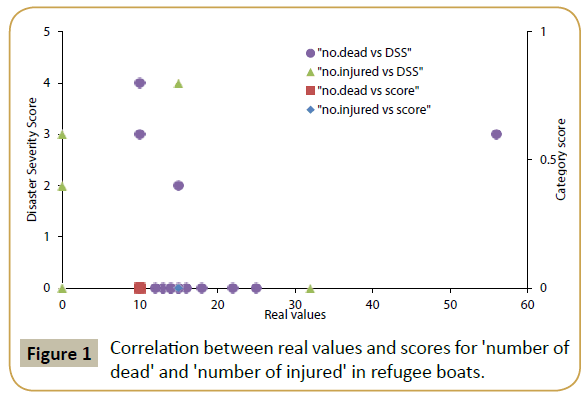
Figure 1: Correlation between real values and scores for 'number of dead' and 'number of injured' in refugee boats.
The correlation between the real world values for the number of dead and the index score or DSS (Figure 2) is 0.98 and 0.85 respectively, while the number of injured vs. the index or DSS was 0.54 and 0.28 respectively. Indicating a positive relationship in either case, but here, care must be taken in interpreting the results due to the small sample size. In both cases, the large distribution of real values vs. the index or disaster severity score leads to a correlation that may not be practical.
In floods (Figure 3) the DSS over time demonstrates a general decrease, especially after 1973 and 1997. The real world reason for this in unclear, but as the other factors remained more or less constant namely, damage to infrastructure, impact time, impact radius and rescue time, the main reason for this decrease can be seen with the changes of ‘number of dead‘ and ‘number of injured’ in 1973 there is a decrease in the both of these factors that also never returned to the previous values, this decrease is reflected in the disaster severity score. The next major decrease in the DSS can be seen in relation to the decrease in the damage to infrastructure in 1997. All three of these factors reflect decreases in the DSS.
Climate based disasters
In climate based disasters (Figure 4) the correlation between the number of dead and its index score were suggestible of a strong correlation (0.85) and a weak relationship between the number of dead and DSS (0.44). The same pattern can be seen in the relationships between number of injured and its index score (0.92) and the DSS (0.53). In storms (Figure 5) since both the individual score and the total scores were the same throughout it was not possible to determine correlation coefficients In this case, the absolute number of dead and the score were suggestible of a correlation between the absolute number of dead and the scoring value (0.92) and a slight relationship between the number of dead and the total score (0.53) indicating a relatively strong relationship between the number of dead and both the scoring systems.
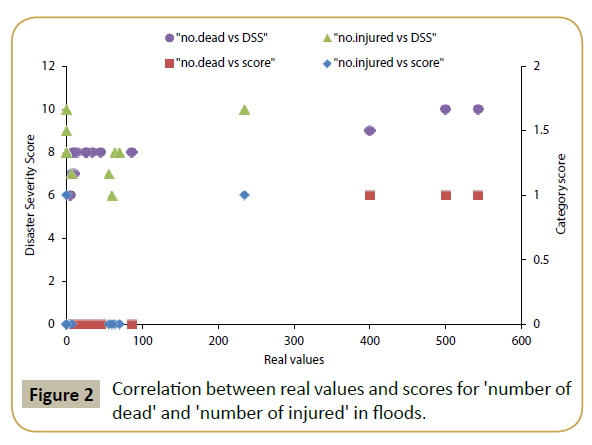
Figure 2: Correlation between real values and scores for 'number of dead' and 'number of injured' in floods.
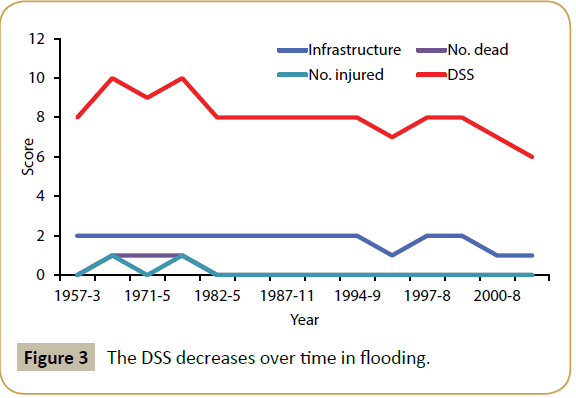
Figure 3: The DSS decreases over time in flooding.
Discussion
Our first observation was the paucity of information, more pronounced in the ‘severity of injuries’ category, for the cases included in this study the data recovered from the media and various disaster websites did not list the types and severity of injuries for those involved. For this reason we had to eliminate this category from our assessment criteria and focus on the rest of the available data. However, this eliminates the human factor of disaster metrics. Considering the lethality of different situations, the causality is not recorded in terms of being due to the event itself, either immediate or long term effects [10] or due to the lack of preparation of the responsible members [11].
Another problem is using online, non-specific sources given that the media is known to over-report casualties in man-made situations and under-report in natural disasters [12] initial reports need to be excluded from data collecting and only verified sources accepted. These sources would be those reporting after the incident and involving statistics and data taken from police or governmental resources. This underpins the idea that a dedicated disaster database is needed keeping as much information as is currently accepted as ‘required’.
For the patera boats that capsized in the Spanish territorial waters, many involved recovery of casualities and not injured persons thus ‘body recovery’ needs to be part of the rescue effort. In this case the majority of the victims were dead with very few injured in total there were 19 rescue attempts with complete data that we considered, of those, there were 321 dead (ave. 16.9, s.d. 10.2) and 47 injured (ave. 2.47, s.d. 7.93) refugees. This ‘body recovery’ can be seen with the air crash on July 3rd 1970 where there were no survivors, it forms part of the ‘rescue effort’ as teams were sent to verify the dead. The current direction of the humanitarian effort is to identify and respect the dead, not mass burials, once this becomes more common practice, recovery of bodies will need to be included into the DSS. Of course, including body recovery into the ‘rescue time’ leads into the DSS never being completed as can be shown with the in the WTC situation, years after there were bodies found while further work was being done [13].
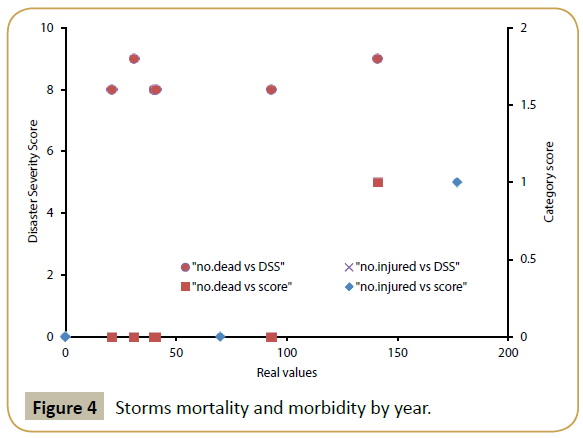
Figure 4: Storms mortality and morbidity by year.
Scoring ‘radius’ the general trend was that in the 25 cases with complete data of the natural-disasters, meteorological, earthquakes and climate-based that we considered the all (100%) were ‘2’ meaning that they extended over a 10km radius. This is to be expected, as a geological or atmospheric disturbance will not be limited to such a small radius. Fortunately, Spain does not experience tornadoes, but this may be the only atmospheric phenomenon that will encompass a small area and have a large impact. As they usually cover such a large area, they also 22/25 (87.5%) were scored with ‘2’ for compound infrastructural damage and few 3/25 (12.5%) scored for simple damage ‘1’ on the disaster severity index. Also natural phenomena are mass casualty situations that keep generating victims throughout and after the event. As such ‘rescue time’, it will be greater than 24 hours in most cases of floods or hurricanes and weather conditions that have a protracted course [14].
In the case of the gas leak ‘Cloro Malaga in 1974’ and the fire in the ‘Discoteca Flying in 1990’ the event reported time was more than 1 hour but the asphyxia due to gas or fire would not be as protracted. This shows a flaw in calculating the ‘impact time’ for these events, where the initial event has the deleterious effect, but continues either unnoticed or uncorrected for a prolonged period. It was previously discussed that the impact area is just limited to where the human population was affected. This may no longer be the accepted standard, as we now need to consider the environmental impacts of disasters and the effect on future generations even though no lives were lost or there was no reported physical injury [15,16].
Considering disasters as a chain of events, ‘impact time’ becomes more difficult to calculate, in 1970 the grounding of the Petrolero Commander resulted in a continuous oil spill that had both a human toll and environmental impact. The causative event, the grounding, lasted less than 1 hour but the oil spill lasted for multiple days. The interpretation of the disaster will result in the scoring, with two events, a grounding and oil spill being scored as (0) and (1-2) respectively, or just one event being scored as with spill being due to the grounding (1-2). This can be seen with the current example of Fukushima Daiichi Nuclear Plant, where the initial event would be scored as ‘0’, but due to the protracted nature of the disaster, the impact time would be ‘2’. These two events should not be separated as they are both; cause and effect (reactor breech and meltdown), and the same (reactor breech with resultant meltdown).
This problem with evaluating ‘impact time’ was not restricted to the human element, but also was noted in the evaluation of La Pantanda flooding, in which the dam failure occurred in less than one hour but for 8 hours prior there was electrical failure to the floodgates, which resulted in the catastrophe. The opposite example of this was seen with the Vertido Andros Patrica in 1978. Here, the explosion occurred in less than 1 hour but the resultant impact and disaster lasted for more than one hour.
‘Impact site’ in most cases this was not reported, usually as it is irrelevant to news stories since the general area is best reported since this is the public concern. The exact area of the ‘impact site’ in many cases was under reported; as such in this study, these criteria were not considered. Evaluating ‘impact site’ again became a process in logistics during maritime disasters, the April 8th 1970 submarine disaster. Fire occurred while the vessel was being towed as such, the actual fire was in one small place (submarine), but due to the movement of the vehicle, it occurred in various geographic locations (route the vessel was towed along). This can also be theorized to happen during the collapse of the immigrant boats, where reports state ‘some of the passengers died and were thrown overboard’ [17].
Further problems with evaluating ‘impact site’ were found when considering natural disasters, earthquake, hurricanes, drought, and hot/cold waves. These events naturally occur over a large area as such, the impact site is inherently larger than 10km and scored ‘2’. These events also occur over a protracted period of time usually more than 24 hours, giving the ‘impact time’ scores of ‘2’. For this reason the DSS may not be practical for these climate based events, and a different scale may be proposed.
Impact site is evaluated on the impact to the population localized to where the casualties have fallen, and this leads to two opposite problems, with the Ensidesa explosion, the effect was felt in an area greater than one kilometer but the victims were within a smaller radius (<1km). This leads to the problem in which we only consider disasters and incidents based on the effect on human lives and not the spread or magnitude. As such a bomb in a church during Sunday mass where the impact site is greater than a kilometer is scored lower than the same bomb after Sunday mass where people are spread over the distance of the impact site, the same event, just with different population distribution. The opposite can be considered in the Ebola situation, where the infected population left the point of contact and moved into the surrounding areas. The core of the affected area remained one village, but due to population movement, the impact site was classed as higher. Of course in most of the cases of Ebola the infected went on to infect others, bringing the disaster area to an increased radius, but in the few cases where the infected was isolated or treated, the impact site was greatly exaggerated due to the distribution of the population.
Natural disasters due to their widespread nature also have a characteristic in the ‘effect on infrastructure’ score. As they cross regional, national and international boundaries, the integrity of the surrounding community is lost as national and international aid is sent to disaster sites. As such, natural disasters are scored as ‘2’ in the infrastructure category.
As we look at the effect of disasters and ‘rescue time’, ’impact area’, ‘number of injured’ and ‘severity of injured’, there is no consideration for the psychological effect of disasters, especially acts of terror which are designed to produce the effects of loss of control and security, they have the added psychological effect. This leads to false measurements of the effect of disasters as multiple studies have shown there are cases of Post-Traumatic Stress Disorder [18], Acute Traumatic Stress Disorder [19] and depression in victims of disasters [20], rescue workers [21,22] and the general population [23]. The current Disaster Severity Scale only takes into account the physical effects of disasters, which becomes misleading especially in terror attacks or large events.
To classify the effects of disasters and multiple casualty events, it might be prudent to take into account the quantity of resources that were available to the given population. An example is the Haiti earthquake of 2010 where there was a paucity of assets and rescue was not available immediately after the earthquake, had this not been the situation the loss of life would have been significantly less. As such, a disaster metrics scale taking into account the population at risk and the available assets and personnel available would give a better account of the scale of the disaster in terms of human life.
By having medical personnel available, it will be feasible to quantify disasters by ‘Medical Transport Capacity’ (MTC), using the ALS and BLS ambulance as standards of measure. Then the victims and severity of injured can be based on the quantity of trips each subset of ambulance makes at full capacity. As serious injured patients can only be carried in ALS ambulances, this removes the NATO categorization T1-T4. ‘Lethal injuries’ in developing countries are not necessarily lethal in developed countries, but would all be classed the same based on the NATO guidelines, based on local triage these patients will be classed differently. During any emergency, there are Samaritans and civilians who carry victims to treatment facilities using private methods. In this case, an additional measure would be the Injury to Hospital Interval [24], the length of time it takes to get victims to treatment regardless of the method and this may be a more real world measure than just ambulances.
Another measure of disasters involving just the human aspect is the ‘Hospital Treatment Capacity’ (HTC) which is the number of victims that the hospital can handle in one hour for each triage category [25]. This measure entails calculating how many victims were produced more than the hospital can routinely treat. This would make the measure specific to countries and areas, as places with fewer resources would be more affected by the same events having the added benefit to function in a prospective manner to measure the changes and improvements in the preparation, planning and response to disasters as with hurricanes in the Philippines. Hospital treatment capacity can be measured both with and without surge capacity [26], as surge capacity shows preplanning, this one added measure functions to quantify preparation.
Disasters affect the entirety of the public health system, and one such score that takes all this into account is the Public Health Impact Severity Scale [27] which includes the Sphere guidelines [26], particularly ‘excess deaths’, due to the incident in this case, the PHSS will have to be adapted to each disaster as it occurs, “increase in diseases”, cannot only be communicable diseases, but in mass casualty events or terrorism, there is an increase in respiratory diseases as seen in the World Trade Centre event. A separate category is the ‘trauma/chemical and radiological diseases’ this will be the most significant of criteria, as trauma will increase almost all disasters and the ‘level of health care services’ is a measure of hospital treatment capacity (HTC), in this way the scale measures the effect on the health care system.
The most common problem we encountered was the lack of information about the types and severity of injuries sustained one of the most important aspects in any scoring system due to the human element. Another problem is the variance due to time and place, as such a good method to quantify the severity of injuries would be the cost of the medical treatment, for all patients, victims and rescuer.
In the short term, the most important aspect in categorizing disasters will be to have a more accessible and comprehensive database. This provides the information that is needed or the link to the persons with this information. A retrospective database search is not practical for long-term scientific disaster-metrics.
Acknowledgement
This research has been partialy funded by the Erasmus Mundus Master course in Public Health in Disasters (Oviedo University).
References
- Bayram JD, Zuabi S (2012) Disaster metrics: quantification of acute medical disasters in trauma-related multiple casualty events through modeling of the Acute Medical Severity Index. Prehospital and Disaster Medicine 27: 130-135.
- LizleBlom, John JM Black (2014) Major incidents. BMJ 348: g1144.
- World Health Organization (2007) Mass Casualty Management Systems. Strategies and Guidelines for building health sector capacity. WHO, Geneve.
- UnitedNations International Strategy for Disaster Reduction (2009) Terminology. UNISDR, Switzerland.
- De Boer J (1997) Tools for evaluating disasters: preliminary results of some hundreds of disasters. European Journal of Emergency Medicine. 4: 107-110.
- Centre for Research on the Epidemiology of Disasters (2016) University of Louvaine. CRED, Belgium
- Relief Web (2015)United Nations.
- Munich Re (2015) NatCatSERVICE. Munich RE, Munich.
- Bayram JD, Zuabi S, McCord CM, Sherak RA, Hsu EB,et al. (2015) Disaster Metrics: Evaluation of de Boer’s Disaster Severity Scale (DSS) Applied to Earthquakes. Prehospital Disaster Medicine 30: 22-21.
- Press TA (2013) Possible human remains found in new 9/11 debris uncovered at World Trade Center site 12 years after attacks. Daily News, New York.
- Bayram JDM, Zuabi S (2012) Disaster Metrics: A Proposed Quantitative Model for Benchmarking Prehospital Medical Response in Trauma-Related Multiple Casualty Events. Prehospital Disaster Medicine 27:123-129.
- Frykberg ER (2002) Medical Management of Disasters and Mass Casualties From Terrorist Bombings: How Can We Cope? Journal of Trauma-Injury Infection & Critical Care 53:201-212.
- Yaw N, Lewis G, Gbenga O, Sari S, Ama de-Graft A, et al. (2015) Preparing for Ebola Virus Disease in West African countries not yet affected: perspectives from Ghanaian health professionals. Globalization and Health 11: 7.
- Boer JD (1995) Order in Chaos, Modelling medical disaster management. Free University Hospital, Amsterdam.
- Cunningham N (2015) The $68 Billion Great Wall of Japan: Fukushima Cleanup Takes on Epic Proportion. Free University Hospital, Amsterdam.
- Exxon Valdez Oil Spill Trustee Council (2014) Oil Remains: The Persistence, Toxicity, and Impact of Exxon Valdez Oil. Exxon Valdez Oil Spill Trustee Council, Alaska.
- Peterson CH (2001) The “Exxon Valdez” oil spill in Alaska: Acute, indirect and chronic effects on the ecosystem. Advances in Marine Biology 39: 1-103.
- Stanton J (2015) Thrown to the sharks: Migrants rescued during treacherous crossing claim body was tossed overboard - as it emerges more than 400 died when another boat capsized on way from Libya to Europe. MailOnline, London.
- Durham TM, Allison EJ (1985)The psychological impact of disaster on rescue personnel. Annals of Emergency Medicine 14: 664-668.
- Grieger TA, Staab JP, Cardeña E, McCarroll JE, Brandt GT,et al. (2000)Acute stress disorder and subsequent post-traumatic stress disorder in a group of exposed disaster workers. Depression and Anxiety 11:183-184.
- Brewin CRA, Valentine B, John D (2000) Meta-analysis of risk factors for posttraumatic stress disorder in trauma-exposed adults. Journal of Consulting and Clinical Psychology 68: 748-766.
- Alexander DA (1993) Stress among police body handlers. A long-term follow-up. The Britist Journal of Psychiatry 163: 806-808.
- Fullerton CS, Wang L (2004) Acute Stress Disorder, Posttraumatic Stress Disorder, and Depression in Disaster or Rescue Workers. The American Journal of Psychiatry 161:1370-1376.
- Hanson RF, Freedy JR, Saunders BE (1995) Los Angeles Country after the 1992 civil disturbances: degree of exposure and impact on mental health. J Consult Clin Psychol 63: 987-986.
- Pasupathy R, Tolk A, Hill R, Kuhl ME (2013) Pre-hospital simulation model for medical disaster management. 2013 Winter Simulations Conference (WSC), Washington DC.
- Bayram JM, Zuabi S, Subbarao I (2011) Disaster Metrics: Quantitative Benchmarking of Hospital Surge Capacity in Trauma-Related Multiple Casualty Events. Disaster Medicine and Public Health Preparedness 5: 117-124.
- Bayram JD, Kirsch TD (2012) Disaster Metrics: A Proposed Quantitative Assessment Tool in Complex Humanitarian Emergencies-The Public Health Impact Severity Scale (PHISS). PLoS Curr 4:e4f7b4bab0d1a3.